The Conservative pledge to introduce national service is by far the most noticed story of the campaign so far, according to my latest poll, while a majority oppose Labour’s plan for votes at 16. We also look at potential tax cuts, the leaders’ attributes, defence and security, and the pensions “quadruple lock”.
What’s going on?
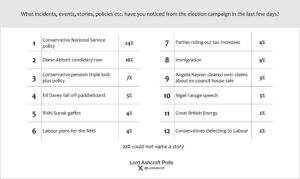
When we asked in an open-ended question what people had noticed from the campaign so far, the Conservative plan for national service was mentioned by nearly a quarter (24%) of respondents, making it by far the most noticed campaign happening to date. The Diane Abbott saga was second, followed by the new Tory pension policy and Ed Davey falling off a paddleboard. The assorted “Rishi Sunak gaffes” included people in the background pulling faces during a speech, and the PM standing under an exit sign.

Our political map shows which parts of the electorate are most likely to have clocked which stories. With the exception of stories about Nigel Farage, immigration and tax, all the stories are most likely to have been noticed on the Labour/Lib Dem/Remain-leaning left hand side of the map. The other side, especially the Leave-voting, Reform-leaning bottom right where many red wall former Tories are to be found, looks largely disengaged from the campaign so far.
National service

2019 Conservative voters were the most likely to back the party’s policy on national service, with two thirds saying they strongly or somewhat supported the idea. Those aged over 65 were more than three times as likely to support the idea (61%) as those aged 18 to 24 (19%).
Votes at 16

Labour’s plan to allow 16 and 17 year-olds to vote in future elections was opposed by more than half (52%) of voters. However, a majority (57%) of 18 to 24s supported the idea, compared to just 1 in 5 of those aged 65 or over.
The quadruple lock

A majority approved of the idea of introducing a new tax-free allowance for pensioners, the policy which has become known as the “quadruple lock”. More than three quarters (77%) of 2019 Tories backed the idea. Those aged 65 or over were 8 times as likely as 18 to 24s to say they strongly approved of the idea.
Defence and security

Asked who they trusted more when it came to Britain’s defence and national security, people were slightly more likely to name Starmer and Labour than Sunak and the Conservatives (by 30% to 27%, including those saying they would trust both). Four in ten said they trusted neither.

Following warnings from the security services that hostile states or extremist groups might try to disrupt the election, just under half (46%) said they were completely or largely confident that the election would be secure from any such interference. One in ten said they were not at all confident.
The leaders
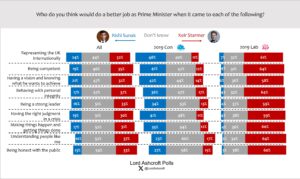
When we asked which leader people thought would do better at various aspects of being prime minister, we found Starmer ahead on all fronts – especially “understanding people like me” (by 27 points), “behaving with personal integrity” and “being honest with the public” (both by 20 points). Sunak’s best score was for “representing the UK internationally” (24%, 12 points behind Starmer).

Overall, Starmer was seen as the best prime minister by 38% to Sunak’s 19%, the gap having widened by 1 point since last week’s poll.
Tories who say they don’t know or won’t vote on 4 July said they preferred Sunak to Starmer by 26% to 8%, with 67% saying “don’t know”. Those currently leaning towards Reform UK preferred Sunak over Starmer by 23% to 7%, with 70% saying ‘don’t know’.

Just under a quarter of voters (23%) say Sunak makes them less inclined to vote for his party – exactly the same proportion that says the same of Starmer. However, while 16% say Starmer makes them more inclined to vote Labour, only 9% say Sunak makes them more likely to want to vote Conservative.
Tax and the economy

When we asked people which taxes they would most like to see cut, the most popular answers were council tax, fuel duty, and income tax – either though lowering rates or raising thresholds. Just under 1 in 5 said it would not be right to cut any of these taxes at the moment.

When we asked which party people thought most likely to deliver their preferred tax cuts in the next few years, the most frequent answer was “neither” – though if anything, the Conservatives were seen as even less likely to cut taxes than Labour.
On running the economy as a whole, people were more likely to think Starmer and Rachel Reeves would do a better job than Sunak and Starmer. Only just over half (51%) of 2019 Tories chose the Tory team. Those currently leaving towards Reform UK chose Sunak and Hunt by 31% to 7%, with 62% saying ‘don’t know’.
The election choice

Only 6% (including 9% of 2019 Tories) said they were satisfied with the current government, with a further 36% saying they were dissatisfied but would still prefer this government to a Labour one.
Nearly three quarters (74%) of 2019 Tories who say they don’t know or won’t vote say they prefer a Conservative government to a Labour one, as do 91% of 2019 Tories currently leaning towards Reform UK.
We ask how likely people think they are to end up voting for each party on a 100-point scale. For 2019 Conservatives, the average likelihood of voting Tory again on 4 July was 45/100, unchanged since last week’s survey.

Of those saying they are more likely than not to vote for a particular party, 47% are currently leaning towards Labour and 23% towards the Conservatives, with 11% saying they currently are most likely to vote for Reform UK and 6% the Lib Dems and Greens. But in this snapshot, we also find large numbers – including 31% of those who voted Tory in 2019 – either giving no party a likelihood score over 50/100 or that they won’t vote at all. In this group, 7 in 10 say that although they’re dissatisfied they would rather have a Conservative government than a Labour one. If these 2019 Tories all go back to the party on election day, the Labour lead narrows from 24 points to 15 points.
In a separate question, we find only 43% saying they have definitely decided how they’re going to vote on 4 July. Only just over half of 2019 Tories leaning towards Labour or Reform UK – 56% and 52% respectively – say they have definitely made up their minds.
The political map
Our political map shows how different issues, attributes, personalities and opinions interact with one another. Each point shows where we are most likely to find people with that characteristic or opinion; the closer the plot points are to each other the more closely related they are.
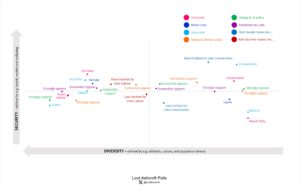
Here we see the distribution of support for the various policy announcements, with policies on national service and pensioner tax thresholds aimed squarely at Conservative-voting territory. Labour’s votes-at-16 policy is also far more likely to be supported on its own side of the map. Notably, those who say Rishi Sunak makes them less inclined to vote Conservative are most likely to be found in the less prosperous, formerly Conservative-leaning bottom right of the map.