I surveyed over 13,000 people on election day who had already cast their vote, to help understand how this extraordinary result came about. The results show who voted for whom, and why.
The demographics
Labour won more than half the vote among those turning out aged 18-24 (57%) and 25-34 (55%), with the Conservatives second in both groups. The Conservatives were ahead among those aged 45-54 (with 43%), 55-64 (with 49%) and 65+ (with 62%).
Men chose the Conservatives over Labour by a 19-point margin (48% to 29%), while women did so by just 6 points (42% to 36%). The Conservatives won among all socio-economic groups by margins of between 6 points (DEs) and 20 points (C2s).
When did you decide?

More than half of voters said they made up their minds within the last month, with a quarter saying they did so within the last few days, including 16% saying they decided on election day or the day they filled in their postal ballot. Labour support was higher among those making up their minds within the last week of the campaign.
How easy was the decision?
39% of all voters said they found their decision harder than usual. Labour (42%) and Lib Dem (56%) voters were more likely to say they found the decision harder than usual than those who voted Conservative (32%). Those who voted Conservative and SNP were the most likely to say they found the decision easier than usual, with 27% of voters for both parties saying they found it much easier than usual.
44% of Remain voters said they found their decision harder than usual, compared to 35% of Leave voters.
Tactical voting
Just over a quarter (26%) of all voters said they were trying to stop the party they liked least from winning, including 43% of those who voted Lib Dem and 31% of Labour voters. One in three Remain voters said they were voting to stop their least preferred party compared to 18% of Leave voters.
Overall, 72% said they were voting for the party they most wanted to win, including 82% of Conservatives, 74% of SNP voters, 67% of Labour voters and just over half (54%) of Lib Dems.
39% of those trying to stop their least preferred party voted Labour, 30% voted Conservative and 20% voted Lib Dem.
Where did 2017 voters go?
84% of 2017 Conservative voters stayed with the Tories, with 8% going to the Lib Dems, 5% going to Labour and 2% going to the Brexit Party. 79% of those who voted Labour in 2017 stayed with the party, while 9% went to the Conservatives, 7% to the Lib Dems, 2% to the Greens and 1% to the Brexit Party. Three quarters of 2017 UKIP voters switched to the Conservatives, with 11% going to the Brexit Party.
Best Prime Minister
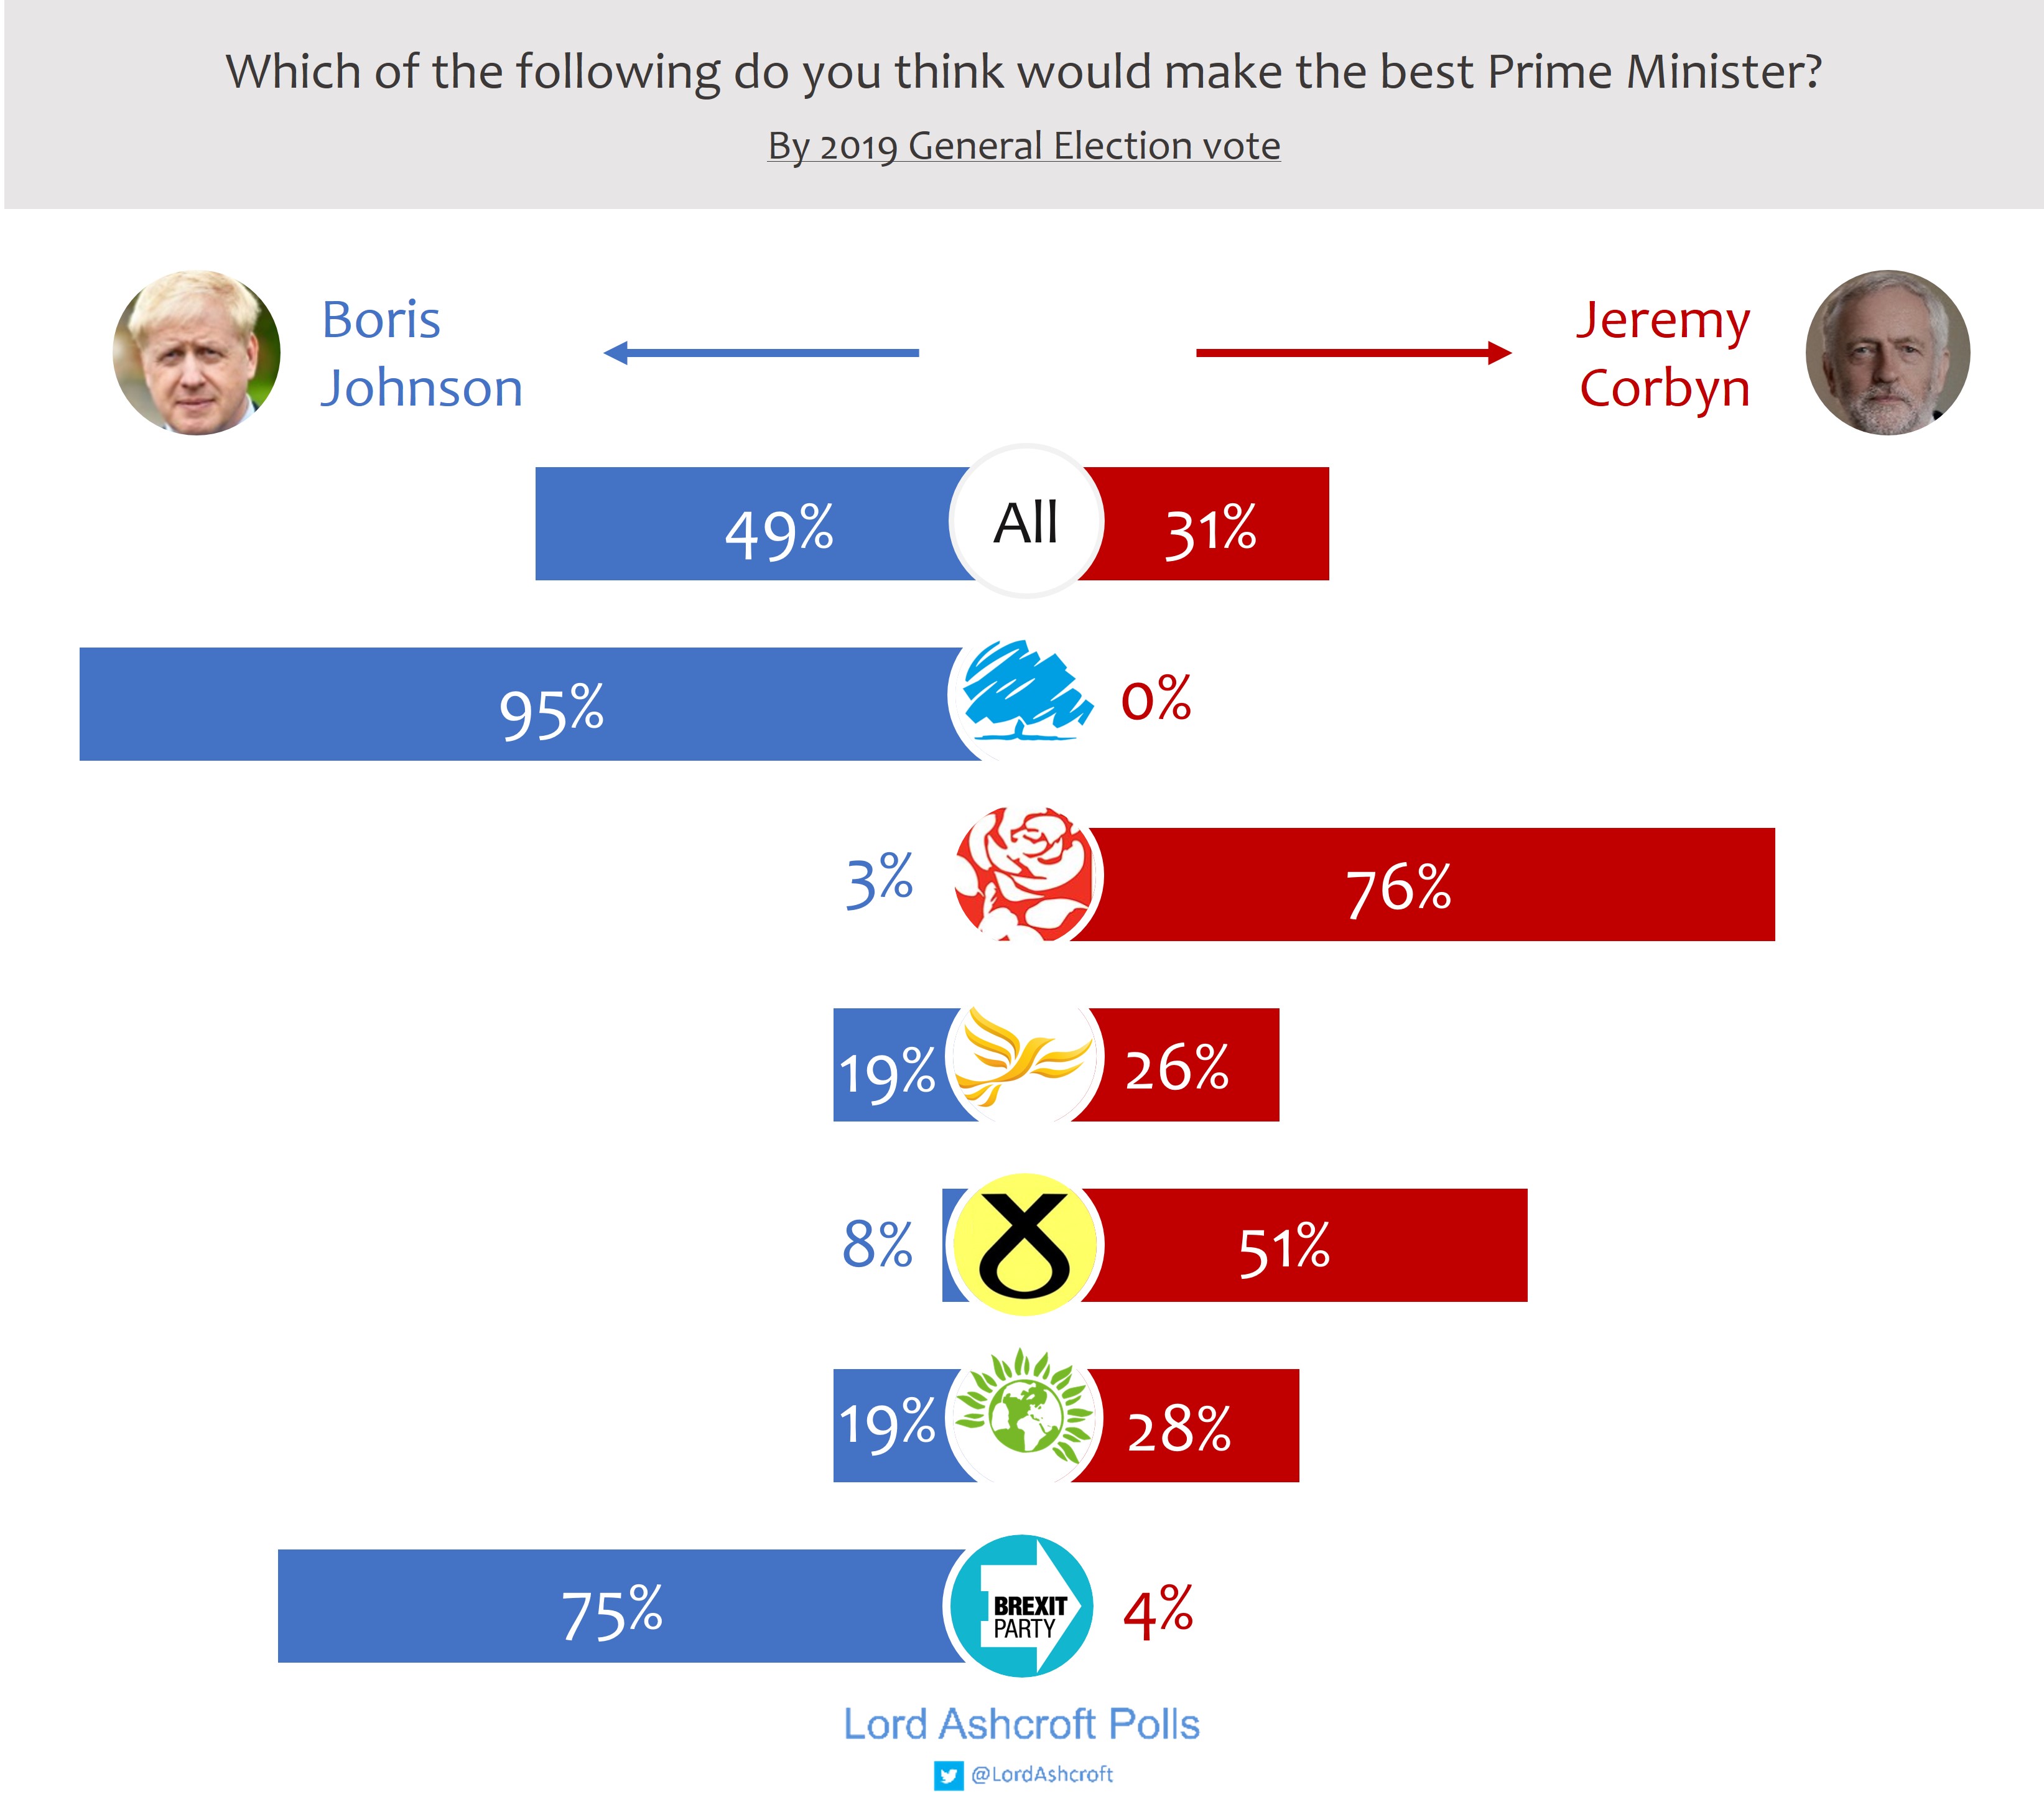
49% of all voters said Boris Johnson would make the best Prime Minister, with 31% naming Jeremy Corbyn and 20% saying they didn’t know. 95% of Conservative voters named Johnson, while 76% of Labour voters named Corbyn. Lib Dem voters named Corbyn over Johnson by 26% 19%, with 55% saying they didn’t know.
The issues
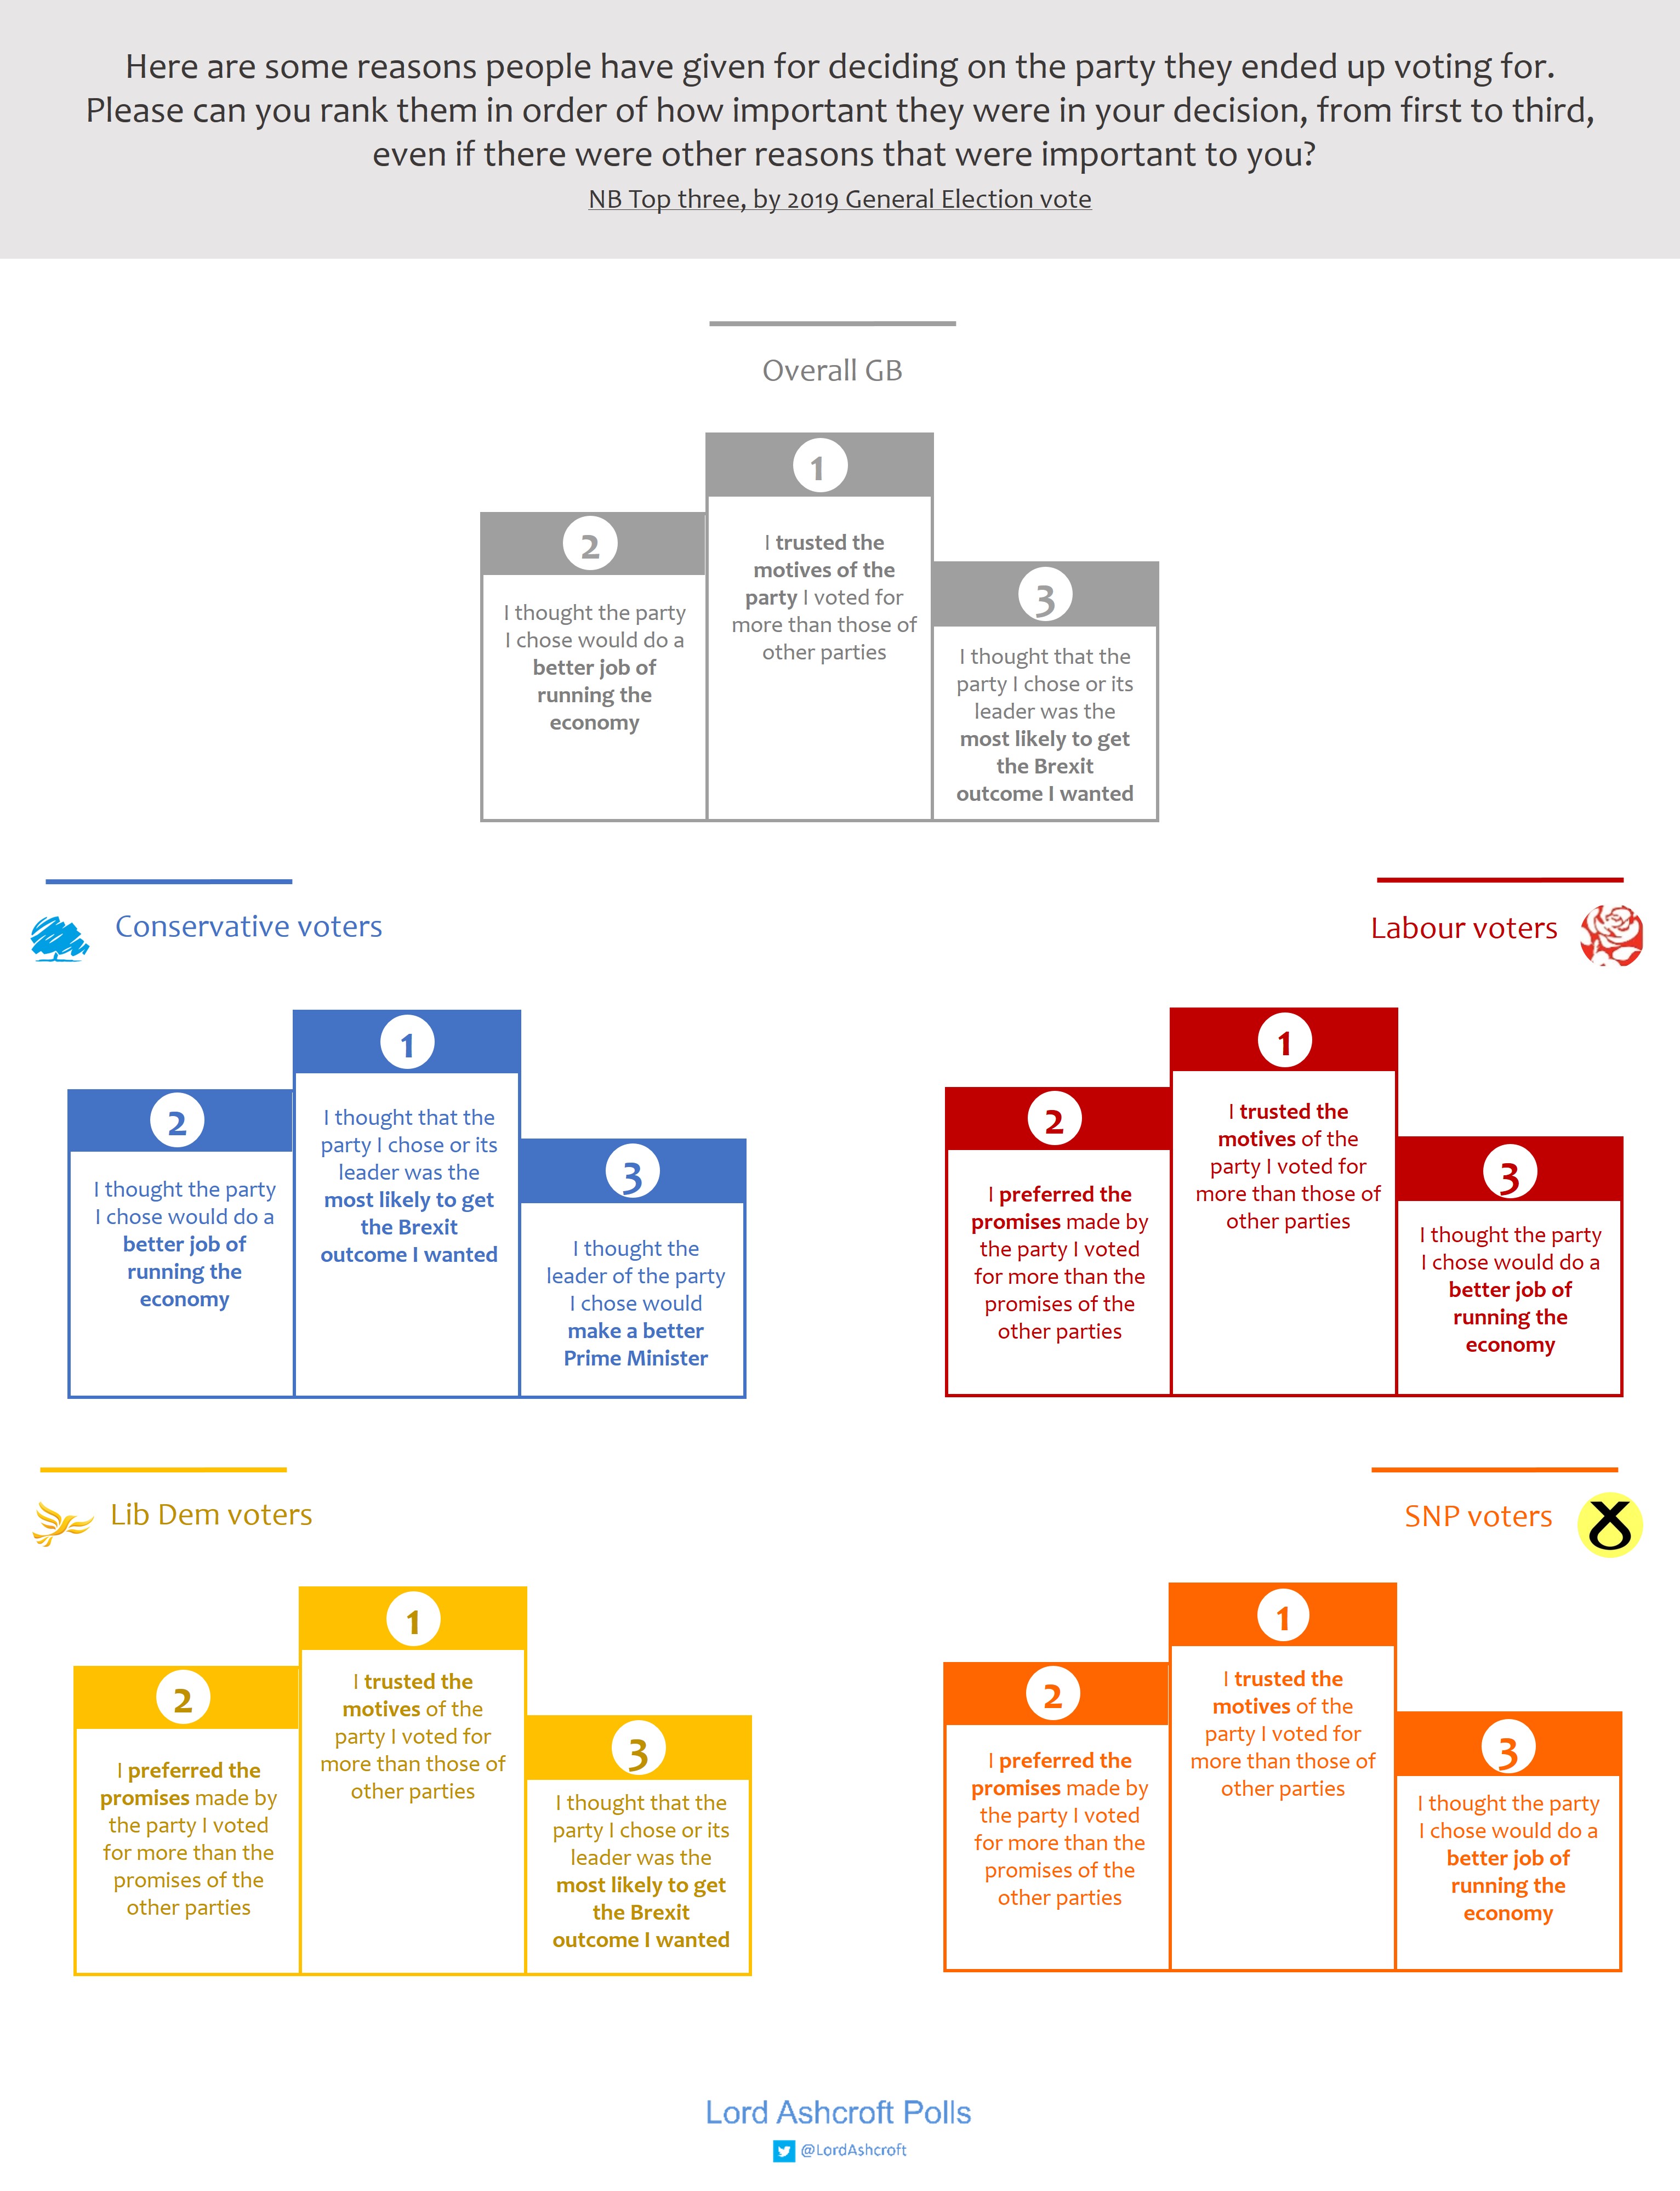
Asked to choose their top three broad reasons for their decision, Conservative voters were most likely to say their party or leader “was the most likely to get the Brexit outcome I wanted” (68%), “would do a better job of running the economy” (64%), and that the leader “would make a better Prime Minister” (58%).
The top reasons Labour voters chose were that they “trusted the motives of the party I voted for more than those of other parties” (65%), that they “preferred the promises made by the party I voted for more than the promises of other parties” (59%), and that they thought Labour would do a better job of running the economy (though only 39% chose this as a reason). Only 19% of Labour voters said that believing the party would get the Brexit outcome they wanted was among their top three reasons for doing so.
For Lib Dems, the most important reason was “trusting the motives of the party” (62%), followed by getting “the Brexit outcome I wanted” and that they “preferred the promises” made by the Lib Dems (both 53%).

Asked to choose from a longer list of issues which three had been the most important in their voting decision, 72% of Conservative voters named getting Brexit done, with 41% naming the NHS, 29% naming the economy and 25% choosing having the right leadership or the best PM. For Labour voters, the NHS was by far the most important issue, named by 74%; 28% mentioned stopping Brexit or getting a second referendum, while 27% mentioned poverty and inequality. Among Lib Dems, 65% mentioned stopping Brexit or a getting second referendum, 58% mentioned the NHS and 30% mentioned climate change and the environment.
The Brexit effect
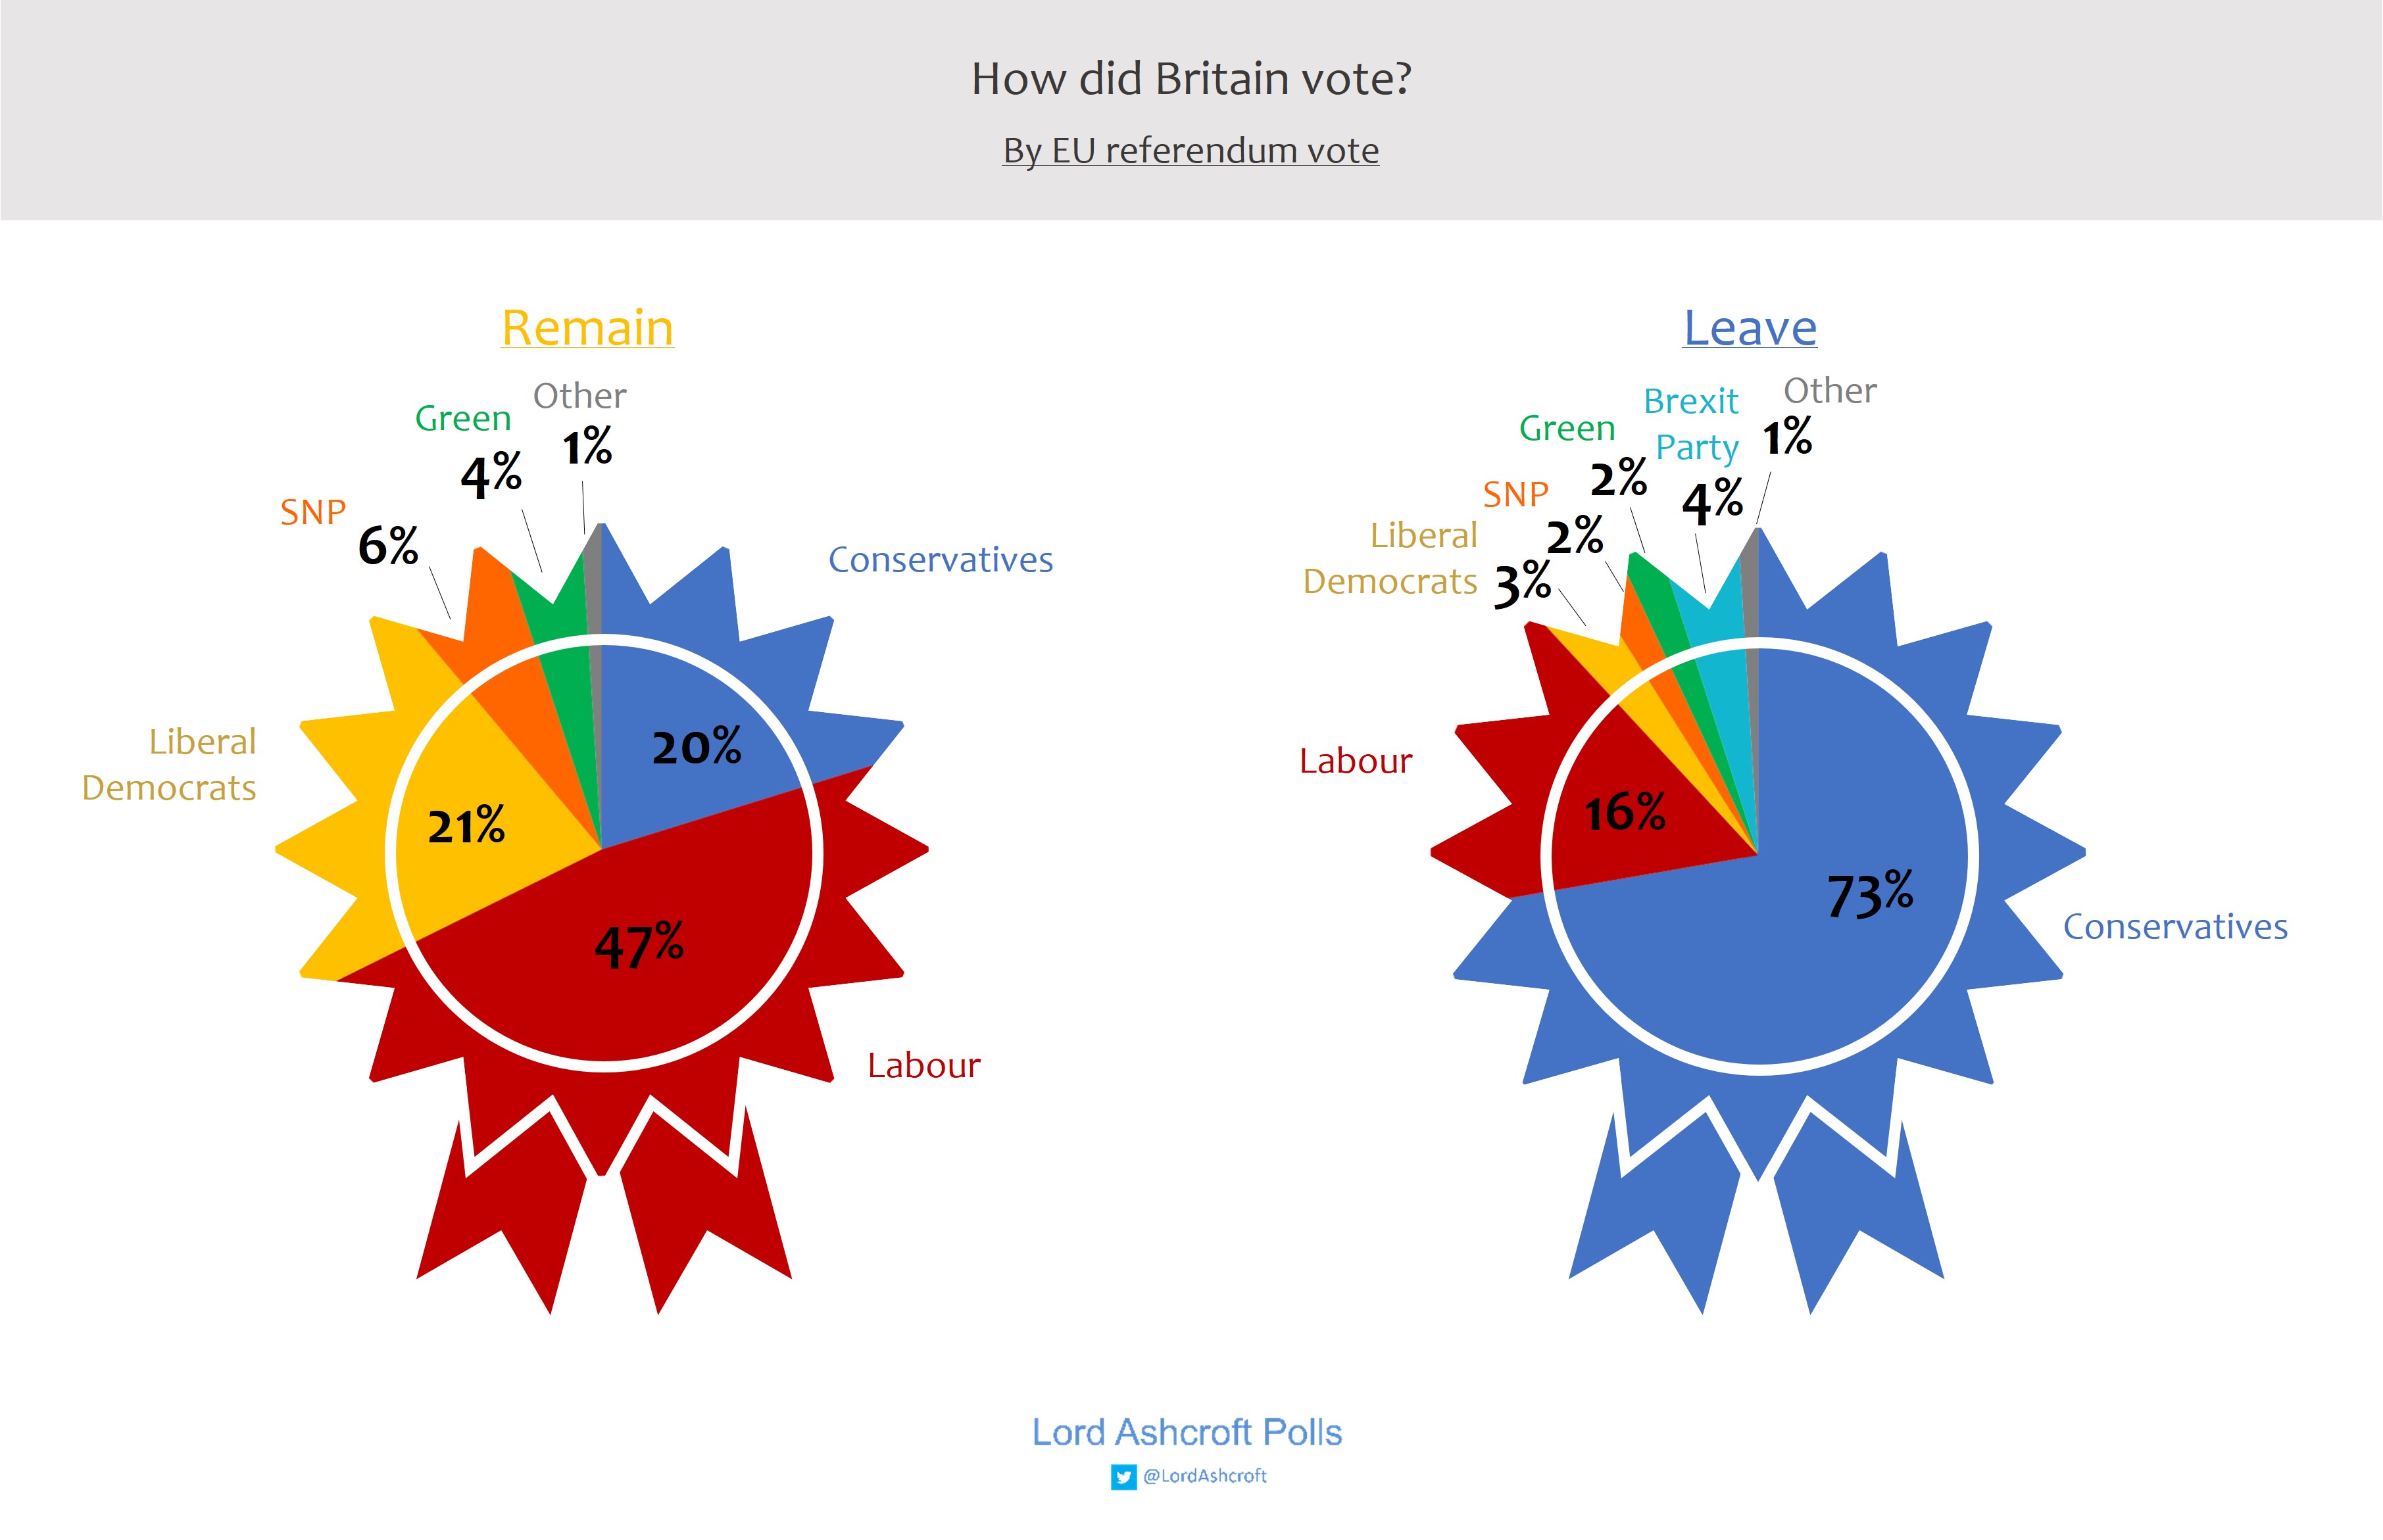
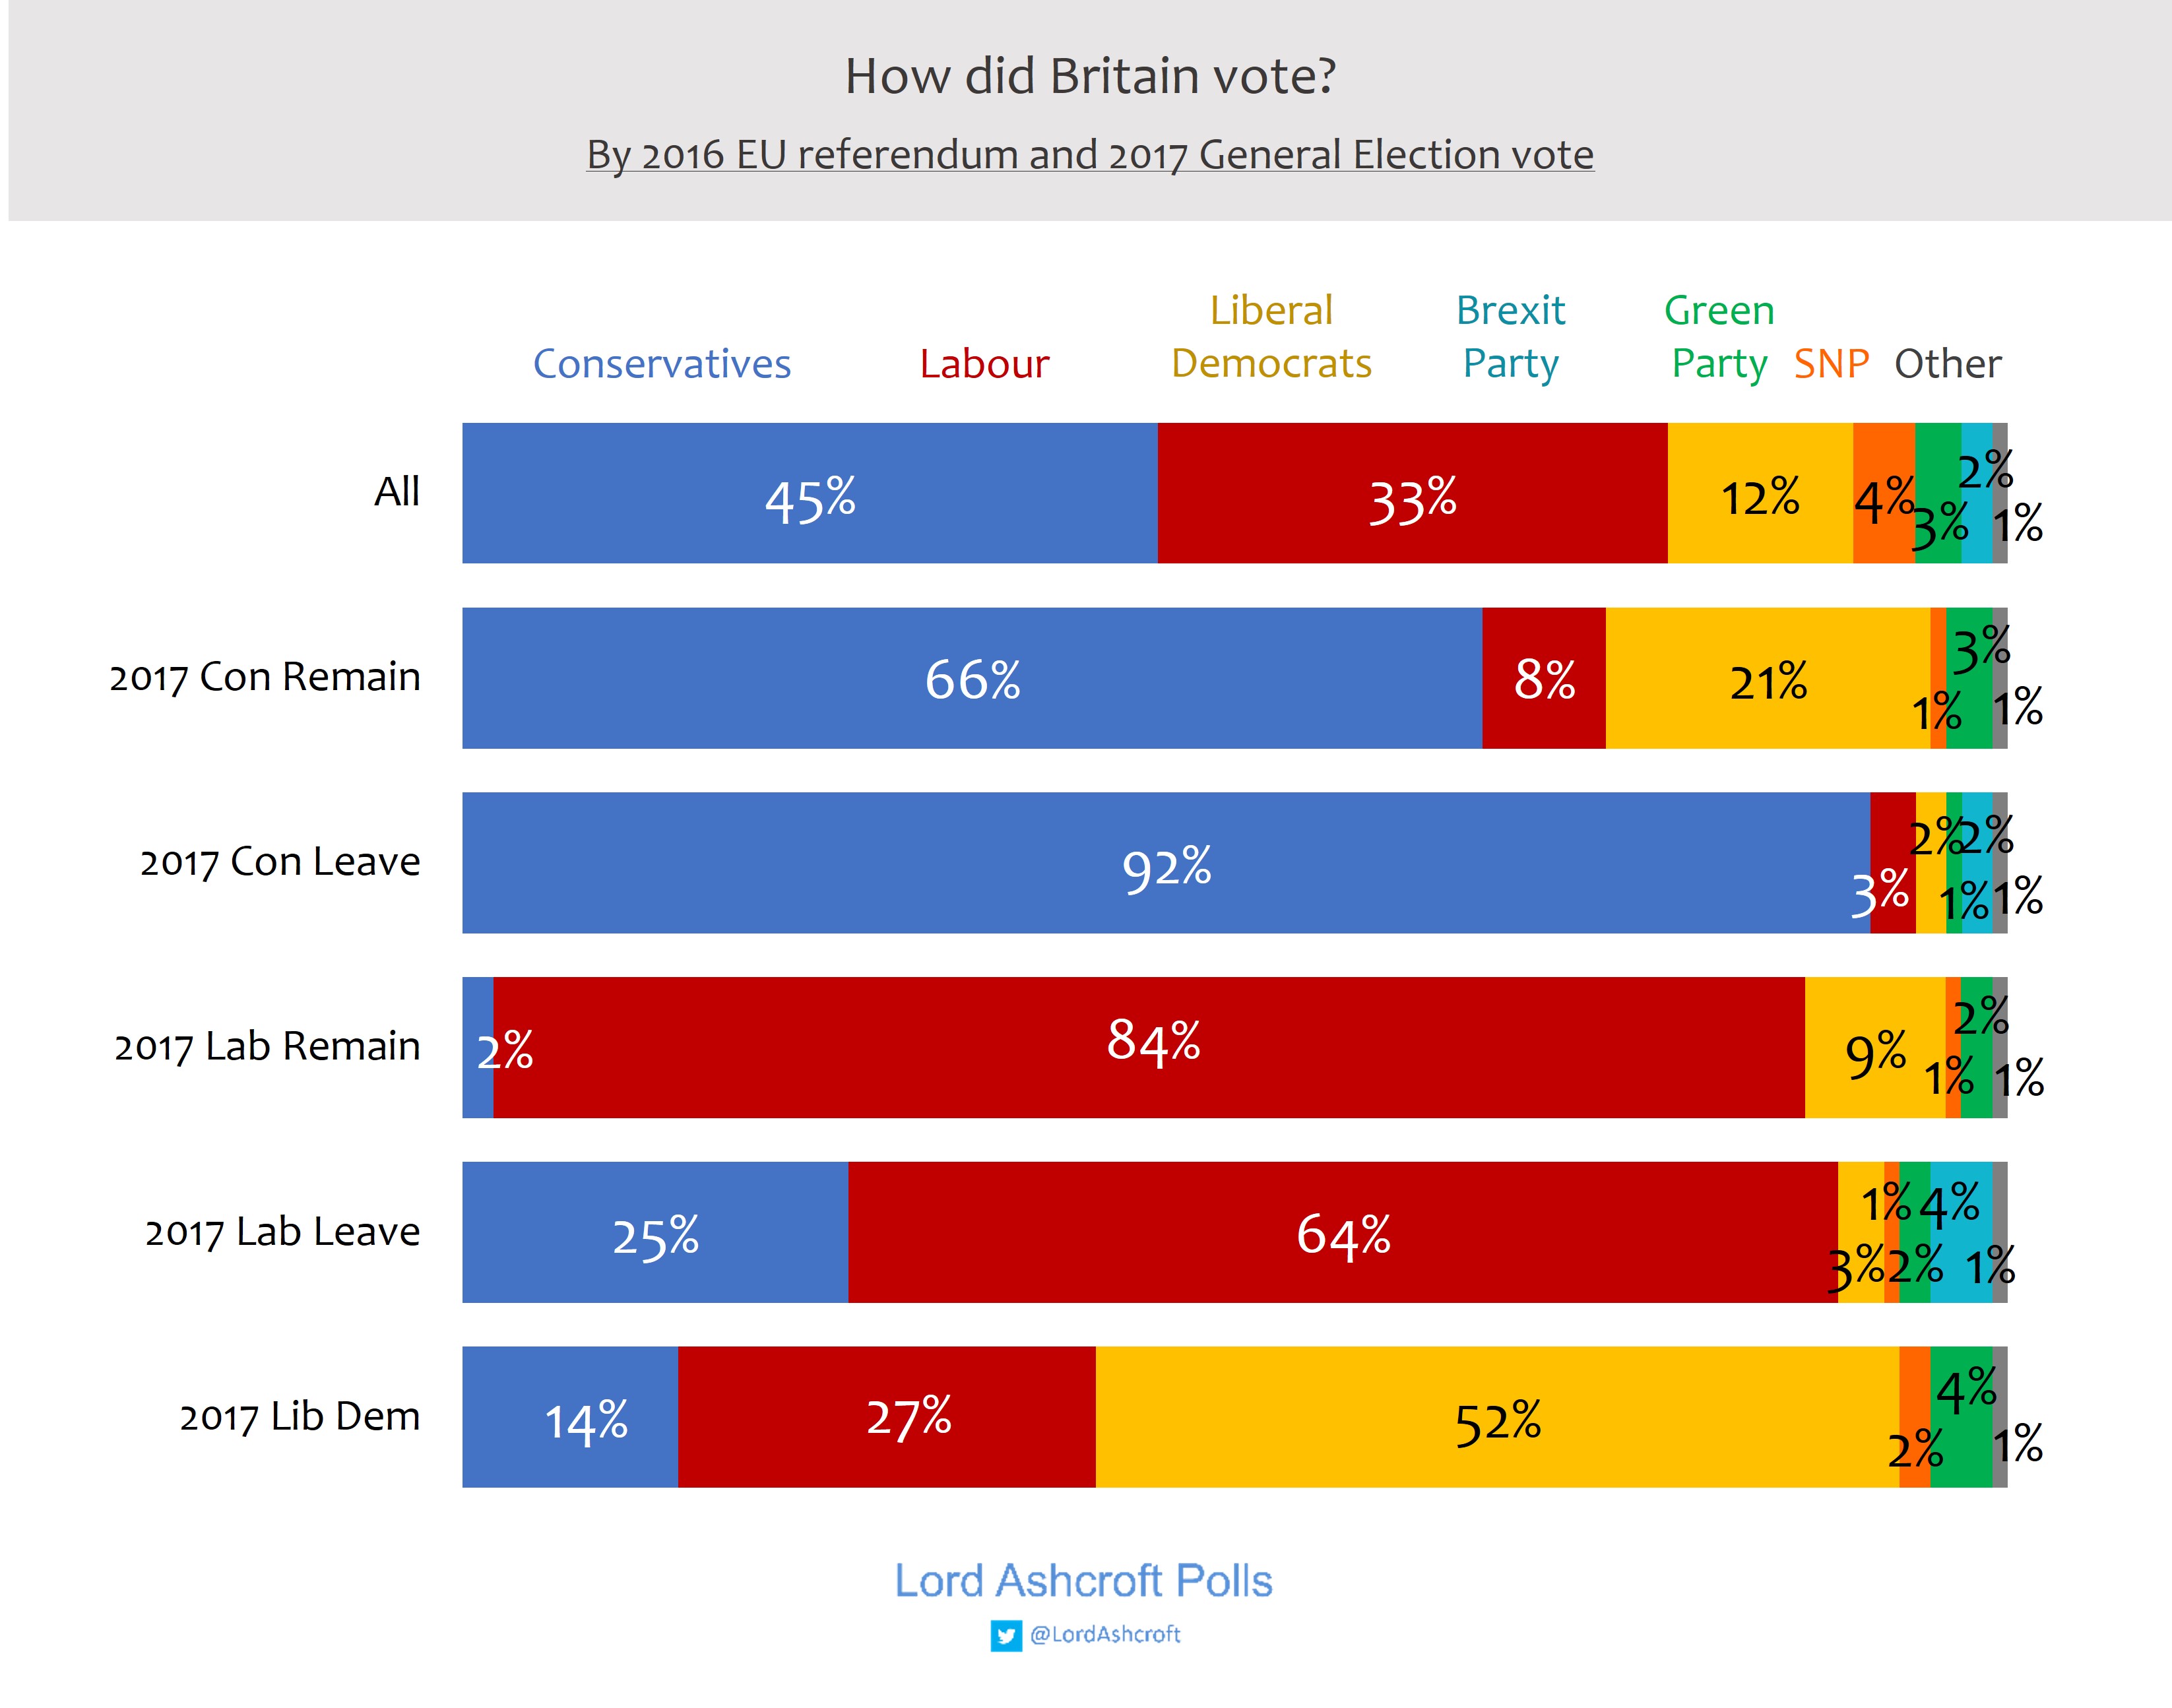
73% of those who voted Leave in the EU referendum voted Conservative, while 16% voted Labour and 4% for the Brexit Party. 92% of 2017 Conservative Leave voters stayed with the Tories. 64% of 2017 Labour Leave voters stayed with Labour, while 25% switched to the Conservatives.
Labour took 47% of the vote among those who voted Remain in the EU referendum, while the Lib Dems took 21% and the Conservatives took 20%. 66% of 2017 Conservative Remain voters stayed with the Conservatives, with 21% going to the Lib Dems and 8% to Labour. 84% of 2017 Labour Remain voters stayed with Labour, while 9% went to the Lib Dems.
One in twenty (5%) said they voted Leave in the 2016 referendum but now think we should remain; 13% said they voted Remain but the referendum result should be honoured.
Nearly three quarters (73%) of Conservative voters said they voted Leave and wanted Brexit to happen as soon as possible; a further 18% said they voted Remain but wanted the referendum result to be honoured. 61% of Labour voters and 76% of Lib Dem voters said they voted Remain and still wanted to prevent Brexit happening if at all possible.
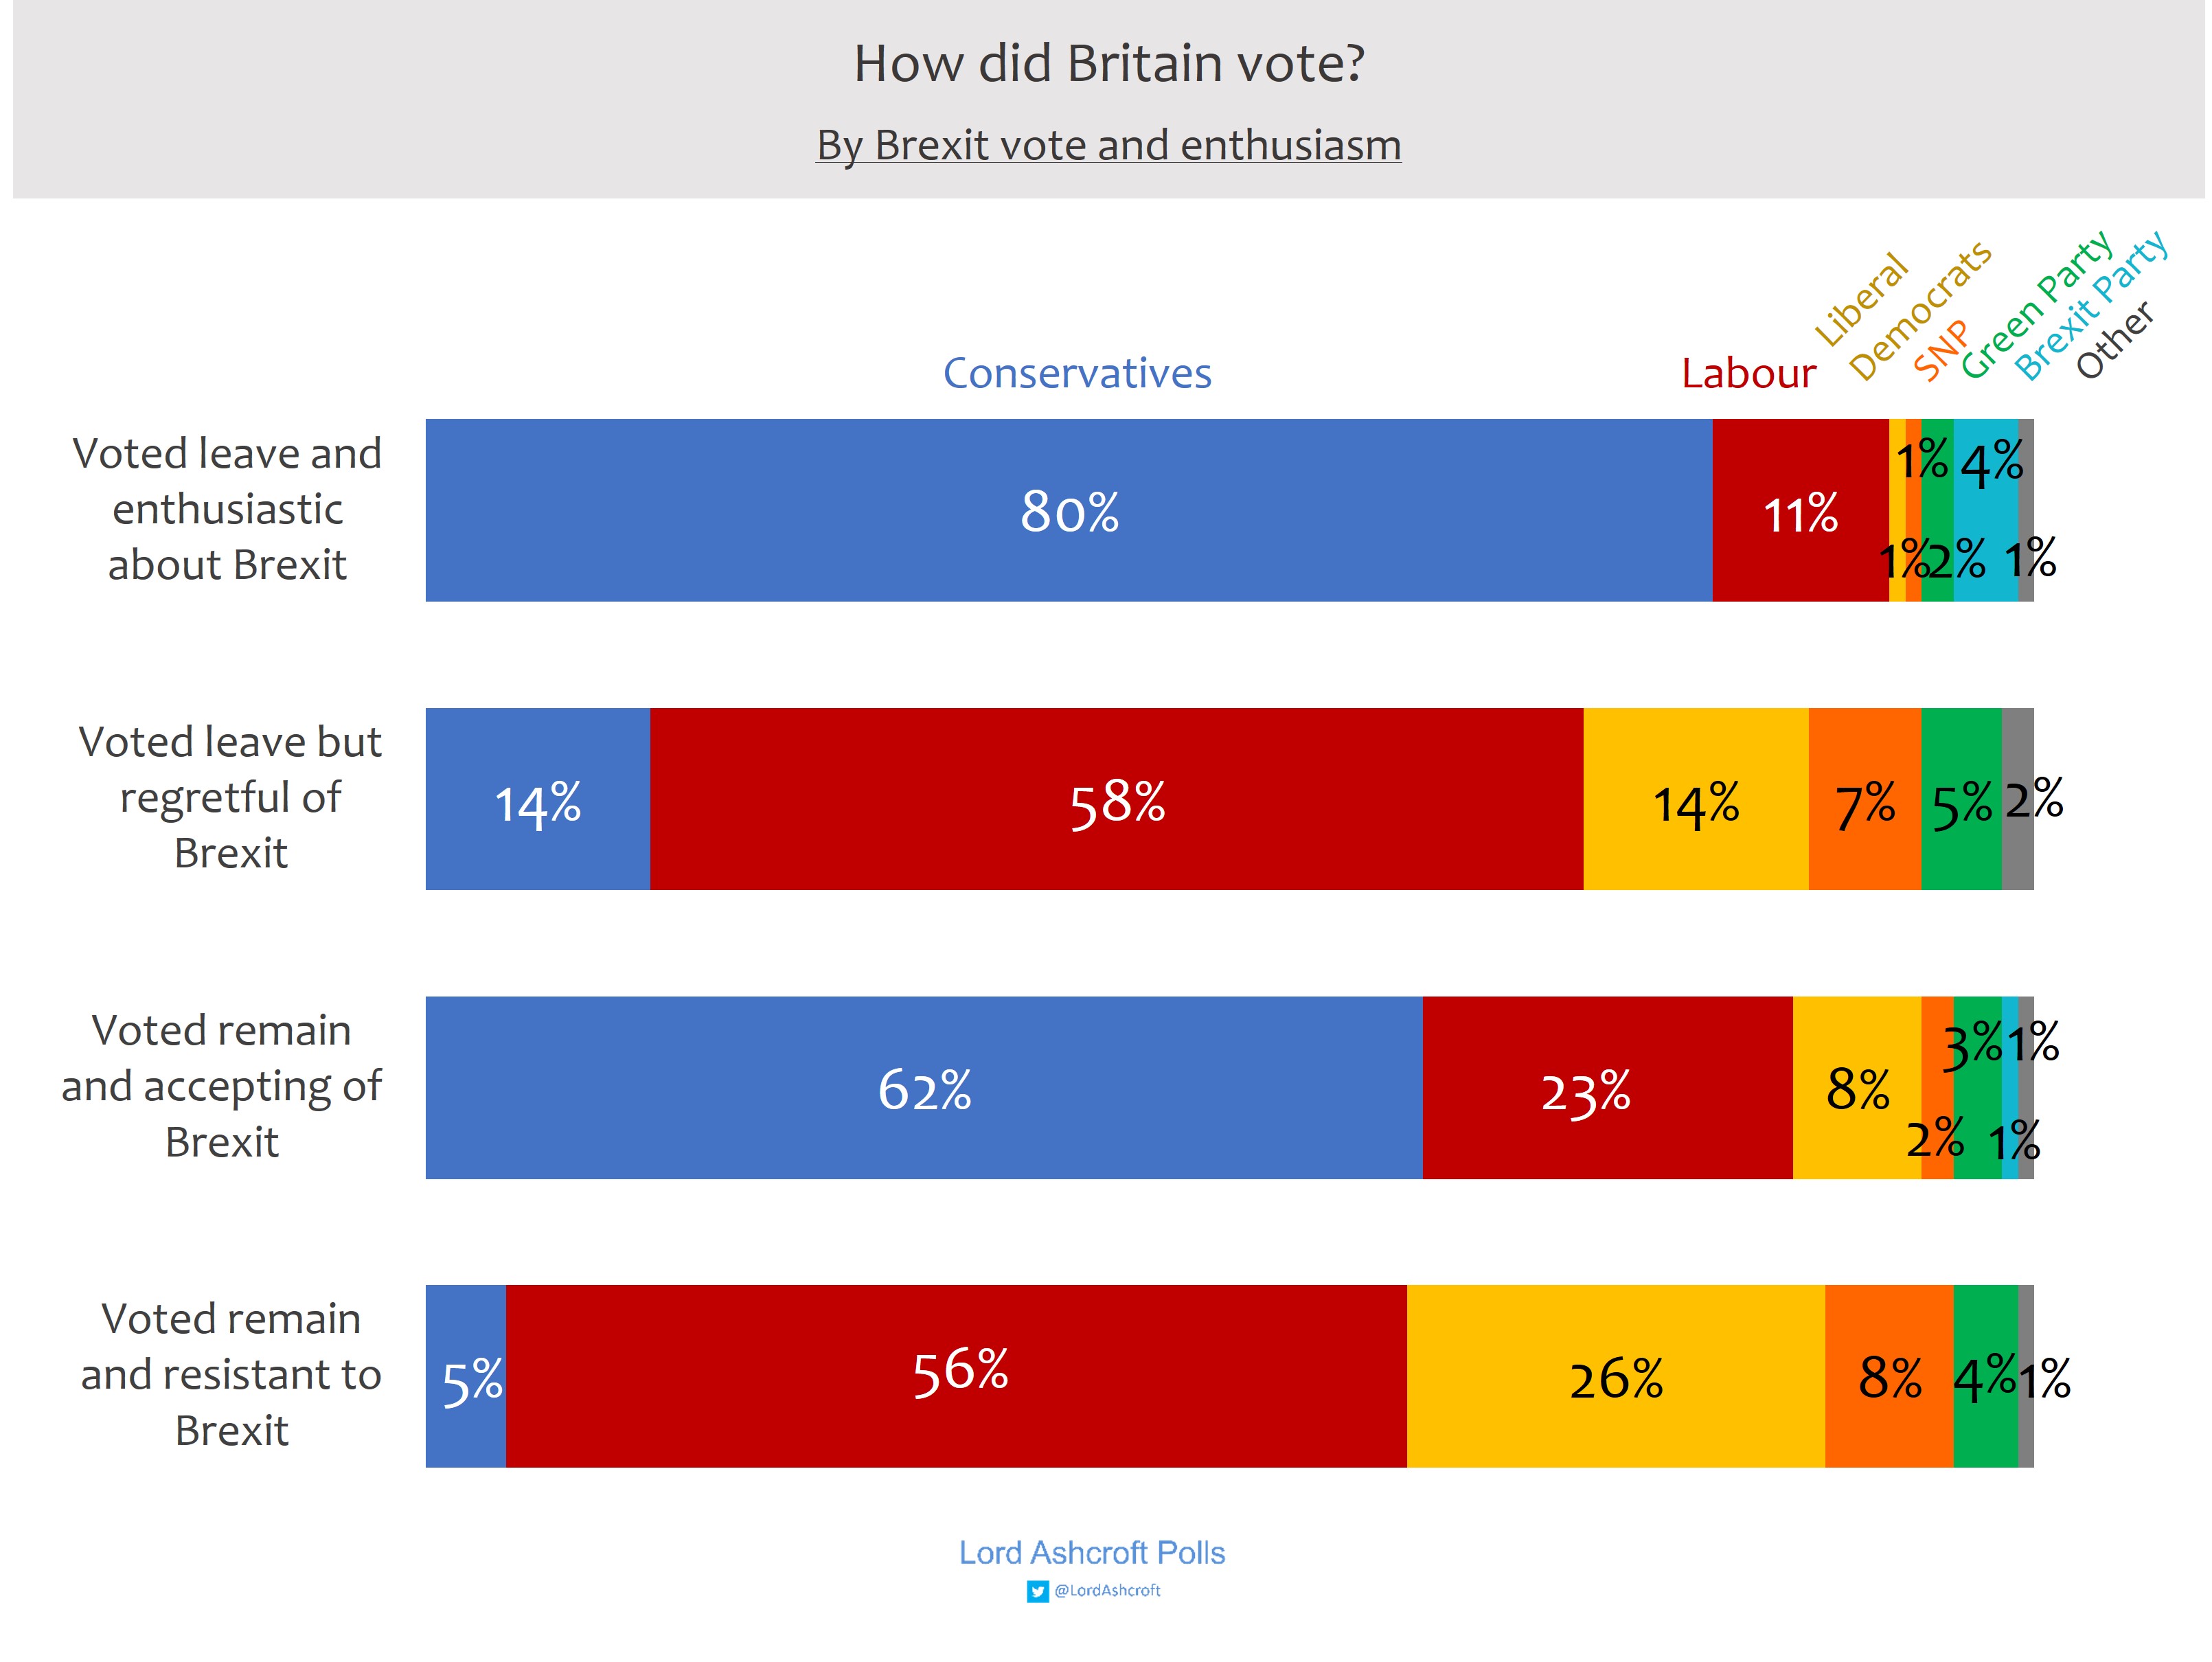
80% of Leave voters who wanted to get on with Brexit voted Conservative, with 11% choosing Labour and 4% the Brexit Party. More than half of Leave voters who now wanted to remain voted Labour (58%), with 14% going to the Lib Dems and another 14% to the Conservatives. Remain voters who wanted the referendum result to be honoured chose the Conservatives over Labour by 62% to 23%, with 8% going to the Lib Dems. Among remainers who still wanted to prevent Brexit if at all possible, just over half (56%) voted Labour, with 26% going to the Lib Dems; 5% of them voted Conservative.
15% of voters said they would probably have voted for a different party had Brexit not been on the agenda at this election. This included 28% of those who ended up voting Lib Dem, 14% of Conservatives, and 11% of Labour voters. 2016 Leave and Remain voters were equally likely to say they would probably have voted differently had it not been for Brexit (16%).
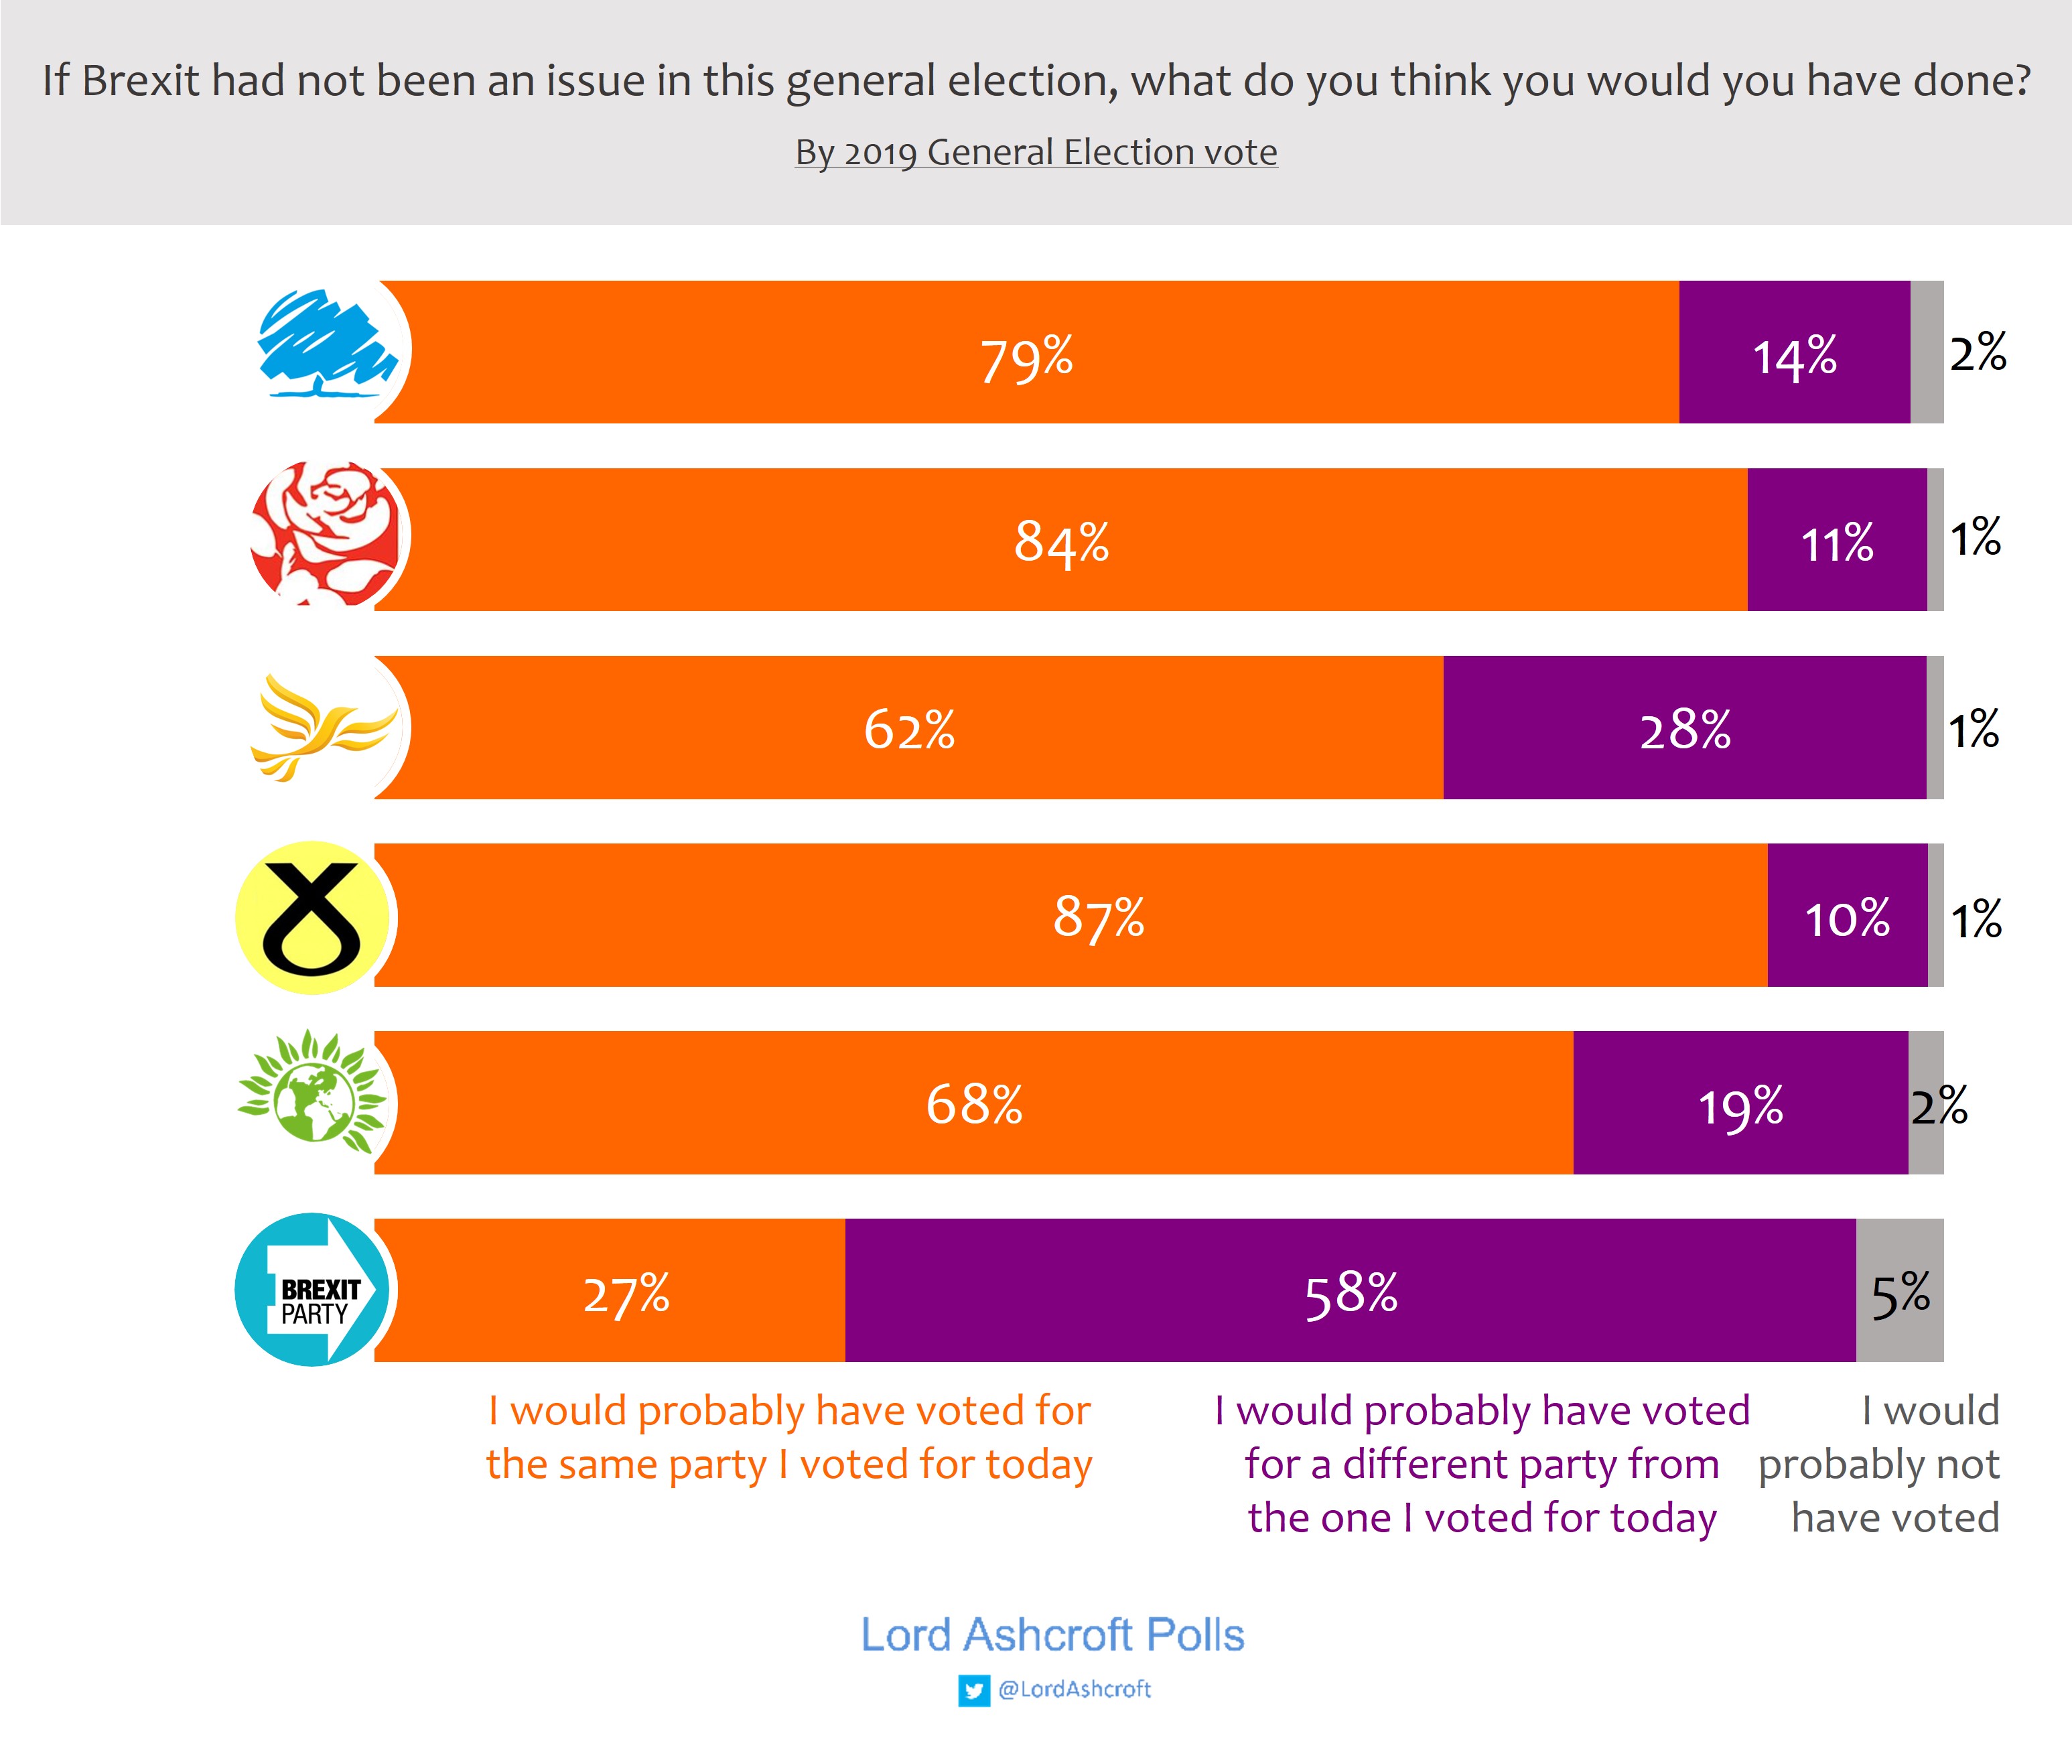
Half of Labour voters who would have voted differently had it not been for Brexit said they would probably have voted Lib Dem; 52% of Lib Dems who would have voted differently had Brexit not been on the agenda said they would probably have voted Conservative.