Last week I launched the Ashcroft Model – a project bringing together large-scale surveys and detailed census data to help understand what could be happening at constituency level in the general election: which party is likely to be ahead in each seat, and the potential implications for overall seat numbers in the House of Commons. I explained how it works here. Today, as will be the case every week until the election, I am updating the model’s estimates based on a further 2,000-sample survey, conducted over the past week but before the party manifesto launches. Here are the main points:
Lack of UKIP candidates most helps the Conservatives
The biggest change since the model’s launch last week is that nominations have closed, which means we now know exactly who is standing where, and more importantly, who is not. UKIP are not fielding candidates in 255 seats, including many where they won thousands of votes in 2015 (often more than the margin between the first and second-placed parties). All the polls show that former UKIP voters are splitting disproportionately for the Conservatives, and this is reflected in the estimates from the Ashcroft Model. Applied to last week’s figures, the absence of UKIP candidates would have put the Conservatives ahead in 416 seats on the basis of a combined probabilistic estimate (that is, when we allocate seats to parties on the basis of their combined win chances across all seats).
According to the model’s updated figures this week, during which Labour’s position has solidified, the combined probabilities currently give the Tories a total of 406 seats, or a potential majority of 162. However – and crucially – the model’s estimates include 95 seats which are only “leaning” to a party, or are “too close to call”.
Probabilities not predictions – and why Labour turnout is key
As I explained when launching the Ashcroft Model last week, we are dealing here with probabilities, not predictions. The model uses the survey and census data to calculate the probability that certain types of people will behave in certain ways, and extrapolates this information to individual constituencies according to the profile of their population. Inevitably, this means we are applying a national model to local areas with their own circumstances, so we should be prepared for some anomalies.
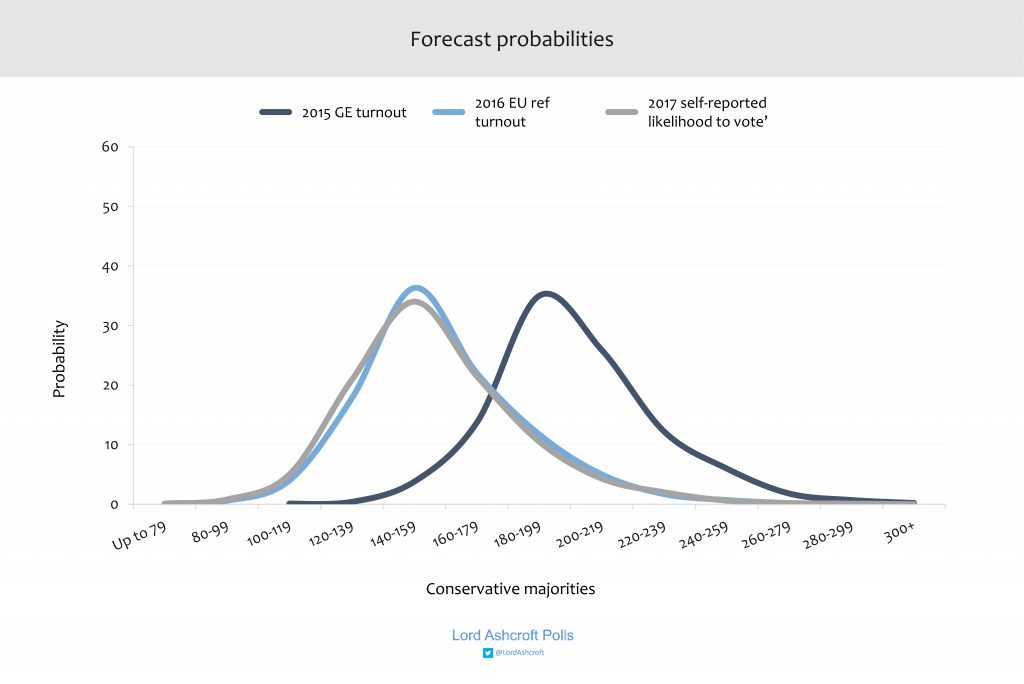
But while the chance of pointing to the right winner in all 632 of the seats covered by the model is remote, it does show the probability of ending up with different overall election outcomes. If turnout were to match the 2015 election, the Ashcroft Model suggests a 13.7% chance of a Conservative majority between 160 and 179, a 35.0% chance of a Conservative majority between 180 and 199, a 25.9% chance of a Conservative majority between 200 and 219, and a 12.2% chance of a Conservative majority between 220 and 239.
It is worth noting here that while the 2015 turnout model uses data from the marked electoral register which shows who actually voted, the 2016 model relies on people’s own recalled turnout, and the 2017 model on their current stated intention to turn up and vote. As the chart above shows, Labour do better in the latter two scenarios than if turnout matches 2015: when figures are based on information about who has provably turned out to vote, Labour do less well than they do when we rely on people’s own reported behaviour or intentions.
Turnout among Labour supporters, then, holds the key to the result. Will Labour’s deep red manifesto motivate jaded supporters? Will Labour voters be spurred to turn out and keep Theresa May’s majority in proportion? Or will they be too demoralised by the state of their party and its prospects to make it to the polling station? (And by the same token, how many Tories will assume the election is comfortably in the bag, and put their feet up?) All these sentiments have been expressed in our recent focus groups, which I am also reporting each week – we will see which tendency wins out.
Anticipating the “Portillo moments”
Perhaps more even than in previous elections, different swings between different parties in different parts of the country will determine the scale of victory or defeat, and whether any party outperforms or underperforms its national vote share. There is no longer any such thing as a uniform national swing, if there ever was: our model estimates some potential by-election-style swings in some kinds of seats (for example, where we find a particular demographic make-up, a high 2015 UKIP vote share and no UKIP candidate this year) but very little movement in others. That means we also know where to look for some of the potential “Portillo moments” – spectacular results with big names losing their seats – some of which are bound to happen if we see an overall result of the kind the national polls and our model currently estimate.
Beyond voting intention
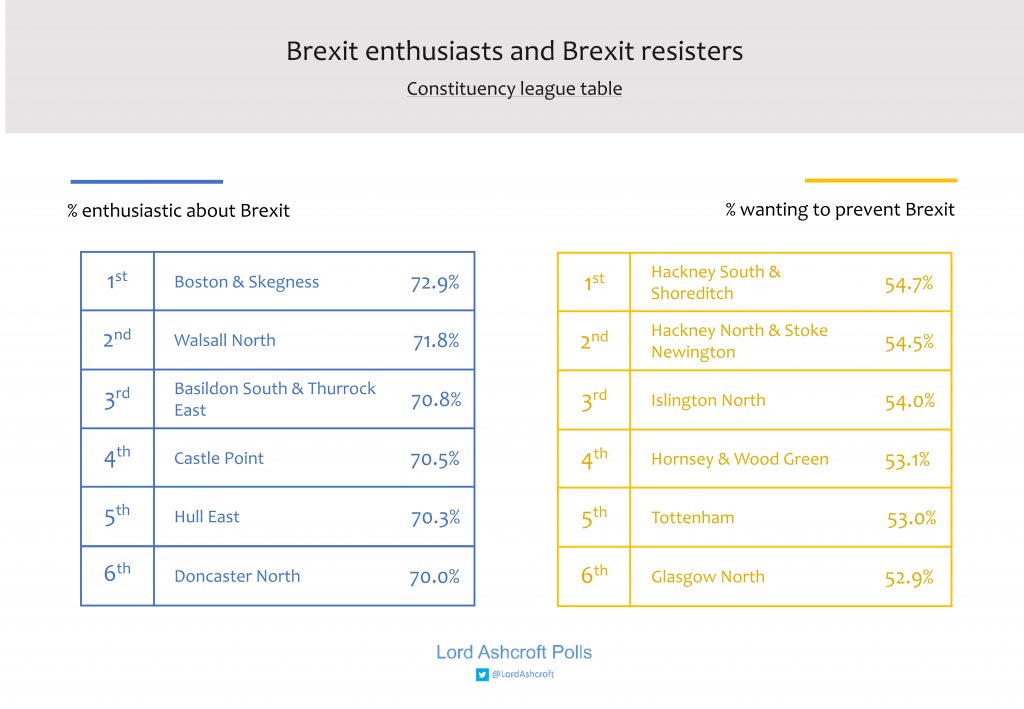
As well as estimates of parties’ chances of winning particular seats, the Ashcroft Model includes data on local electorates’ attitudes to Brexit, the economy, and social and cultural questions. Here are the constituencies most enthusiastic about the prospect of Brexit, and those who would most like to prevent it from happening if that were possible:
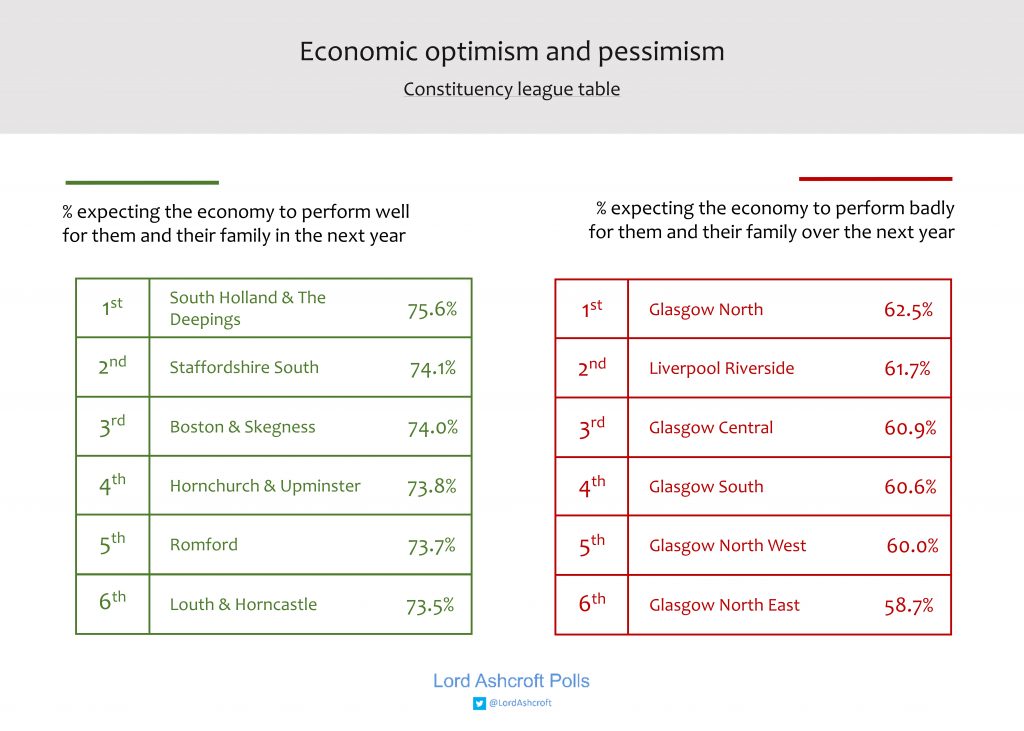
These are the most – and least – optimistic about economic prospects for themselves and their families over the next year:
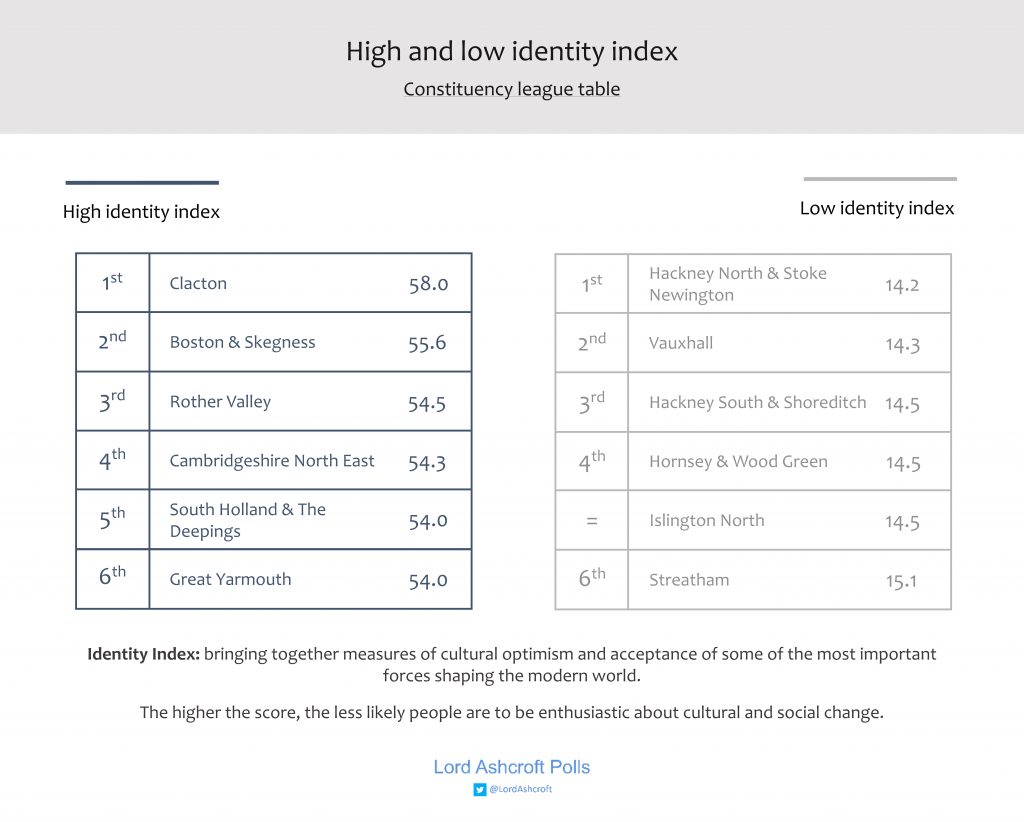
And these are the seats with the highest and lowest scores on what we have called the Identity Index – a measure combining answers to questions about social attitudes on immigration, multiculturalism, social liberalism, feminism, the green movement, globalisation, whether changes in society in recent years have mostly been for better or worse, and whether or not life in Britain is better than it was thirty years ago.
Click here to see the Ashcroft Model’s updated estimates – including whether constituency seat is “likely” or “leaning” for a party or “too close to call”, whether local voters are enthusiastic or resistant towards Brexit, their preferred Prime Minister and their level of personal economic optimism – and the potential implications for parliamentary seats after 8 June.
