The night of 7 May, 2015 is one that most pollsters would rather forget. Different surveys using different methodologies came to the collective conclusion that Britain was set for something close to a dead heat – an expectation that was shattered by the official exit poll and quickly swept away as results began to pile up. My own final national poll, completed the night before the election, also produced a tie between Labour and the Tories. Not only that, I had published polls in more than 160 individual constituencies – some of which proved to be bang on, and others of which, let’s be honest, didn’t.
The British Polling Council’s subsequent inquiry into the polls’ performance concluded that the problem had been one of sampling: that the people who took part in surveys were not properly representative of the wider public. This challenge has made polling on voting intention an increasingly hazardous business. The various pollsters whose results we read every day have adjusted their methods in the light of the inquiry’s findings, and I wish them nothing but the very best of luck. But for this election, I have decided to try something different.
Today I am launching a new model designed to estimate opinion across the country and in individual constituencies, and to give a sense of how this could translate into seats in the House of Commons. The Ashcroft Model is based on Multilevel Regression and Poststratification, or MRP – a process that combines survey results with concrete demographic and other information to calculate the probability that a certain individual will have a certain view, given what we already know about them. The project will make available the kind of information that is increasingly used by political parties and professional campaigns, but rarely finds its way into the public domain.
The Ashcroft Model combines the results of a 40,000-sample survey (the biggest I have ever conducted) with detailed census data. This shows us the likelihood that particular kinds of people – in terms of their age, sex, occupation, level of education, and so on – will have a particular opinion. It uses information from people of the same demographic background but who are from substantially different geographic areas to help calculate these probabilities. Crucially, the model then allows us to extrapolate this information to individual constituencies according to the profile of their population. On this basis we make estimates including whether each seat is “likely” or “leaning” to one party, or is “too close to call”; views on the best Prime Minister; and the level of personal economic optimism in each constituency – together with the potential implications for seat numbers for each party and the new government’s majority. The direction of each seat – and the implied range of potential gains and losses – are presented on the basis of three different scenarios: if turnout in June is as it was in 2015, if it matches that of the EU referendum, and if people turn out according to their own stated likelihood to do so. Estimates for each seat will be updated on the basis of new surveys each week until polling day.
Just as traditional polling comes with caveats – that figures are subject to a margin of error, and only represent a snapshot in time – the Ashcroft Model comes with stipulations of its own. To adapt my 2015 mantra, we will be dealing with probabilities, not predictions. The combination of survey and census data will show the probability that certain types of people will behave in certain ways, and the data is presented on that basis. This in turn means that we are applying a national model to specific local areas with their own circumstances. Though we will continue to refine the model as we update the findings each week, we should be prepared for a few anomalies. The seat-by-seat estimates – and, by extension, the implied parliamentary majorities – are therefore not by any means hard and fast predictions. Modelling techniques like this are more widely used in America, where it is regarded as an amazing achievement (or a massive fluke) to forecast the right result in all fifty states – never mind 632 separate parliamentary seats. The chances of showing the right winner in every constituency are extremely small.
In launching the Ashcroft Model I am not giving up on polling. It remains a useful guide to public opinion on issues of the day and how things look to different kinds of people – indeed this year the final polls may give a good indication of the parties’ vote shares. I want to see if there is a better means of assessing what is going on at constituency level than we managed in 2015. Alongside my weekly focus groups, which began last week in London and continue this week in the West Midlands – I hope the Ashcroft Model helps to clarify what is happening in this general election, where the action is, and how things are shaping up.
So: what do the first results tell us? The Ashcroft Model currently estimates that the Tories are ahead in between 406 and 415 constituencies, depending on whether turnout matches that of the 2015 election, the 2016 referendum, or voters’ own declared likelihood to turn up on 8 June. This implies an overall Conservative majority of between 162 and 180 seats in the House of Commons – but don’t forget, we are talking about probabilities not predictions: within those figures, 39 seats are categorised as “too close to call” and a further 63 are only “leaning” towards rather than “likely” for one party.
In the 40,000-sample survey, just over six in ten (61%) of those intending to vote Conservative said they voted Leave in the referendum; around two thirds of Labour (64%) and SNP voters (68%) voted Remain, as did 82% of those planning to vote Lib Dem. Just under half (46%) of voters overall, but 63% of Conservatives, were enthusiastic about Brexit; one quarter said they had voted to remain in the EU but the result “must be honoured and we need to get on with it”, while 29% – but nearly two-thirds of Lib Dems – said they “would still like to prevent Brexit from happening if at all possible”. Our model suggests that Boston & Skegness is the most pro-Brexit constituency in the country, with 73% of its residents enthusiastic at the prospect; Hackney North & Stoke Newington is the most Brexit-resistant, with 54% likely to want to reverse the decision.
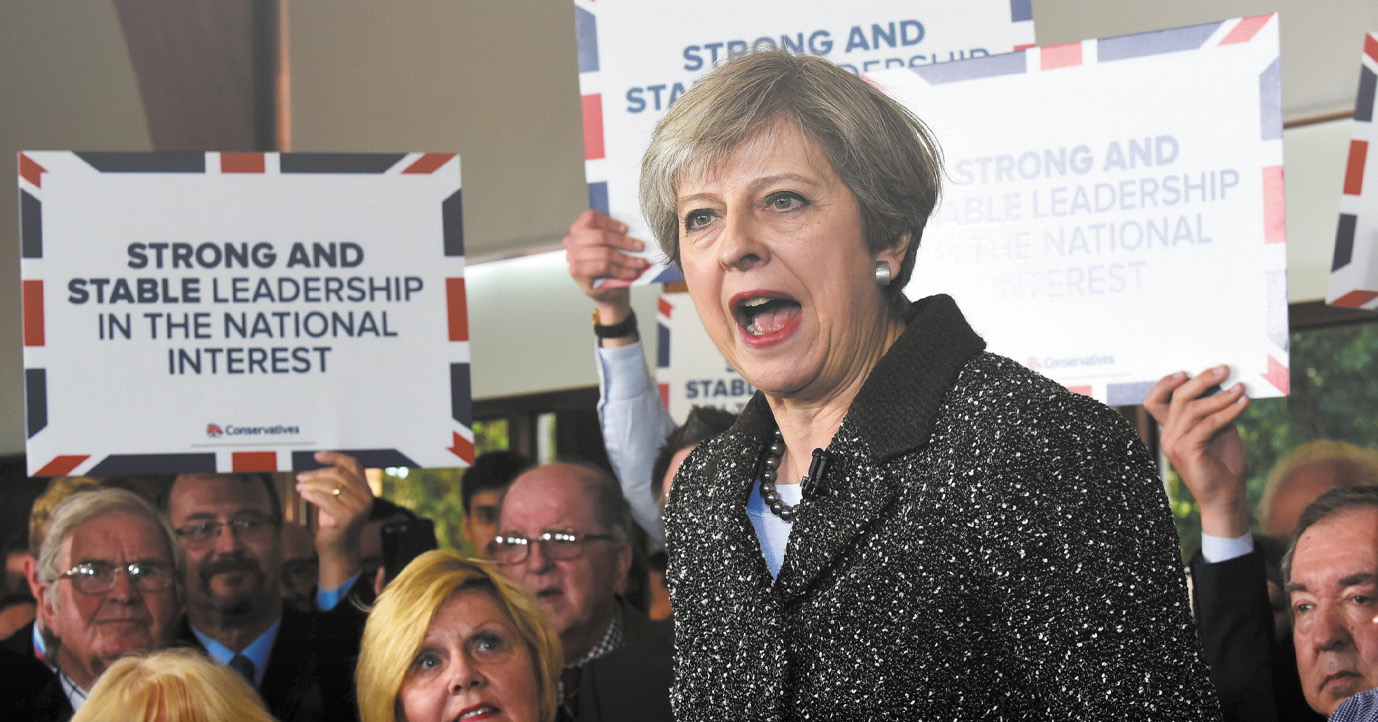
Three quarters of Tories said they thought Britain was on the right track, while seven in ten Labour voters and three quarters of Lib Dems and SNP supporters said the country was going in the wrong direction. Perhaps not surprisingly, 99% of Conservative voters said they thought Theresa May would make the best Prime Minister of the three main party leaders. One in five Labour voters, 36% of Lib Dems and nearly three in ten Scottish Nationalists said the same.
On the economy, Tories were optimistic both for themselves and the country by huge margins. Other parties’ supporters thought economic prospects for themselves and their families were better than for Britain as a whole; the discrepancy was particularly marked among Lib Dems, who were nearly three times as pessimistic for the country as they were personally. The most optimistic constituency was South Holland & The Deepings, where the model suggests 77% of voters think the economy will do very or quite well for them and their families over the next year; the most pessimistic was Glasgow North, where 64% are likely to think things will get worse.
As part of the model we have combined people’s answers to a number of questions about social attitudes – on immigration, multiculturalism, social liberalism, feminism, the green movement, globalisation, whether changes in society in recent years have mostly been for better or worse, and whether or not life in Britain is better than it was thirty years ago – to create what we call the Identity Index. Positive answers to these questions mean a low score; a more negative view leads to a higher score. Conservative voters, with a score of 51.32, come closest to the national mean score of 44.95. Lib Dem voters have the lowest score of all (31.71), followed by Labour (35.74) and SNP supporters (36.98). At 65.79, UKIP voters have the highest score on the Identity Index. In constituency terms, Boston & Skegness again topped the table, with an estimated average Identity Index score across the constituency of 59.23; at the other end of the spectrum was Hornsey & Wood Green, with 13.93.
The overall and constituency-by-constituency estimates from the Ashcroft Model will be updated every week until the election at Lord Ashcroft Polls.
Click here to see the Ashcroft Model’s constituency-by-constituency estimates and the implications for parliamentary seats


