The final results from the Ashcroft Model shows an increase in the estimated Conservative majority compared to Tuesday’s figures. The new data is based on an updated survey conducted on Tuesday and Wednesday, which found a hardening of the Conservative vote as Tory supporters gave a higher likelihood of turning out to vote than in previous rounds. The upshot is as follows:
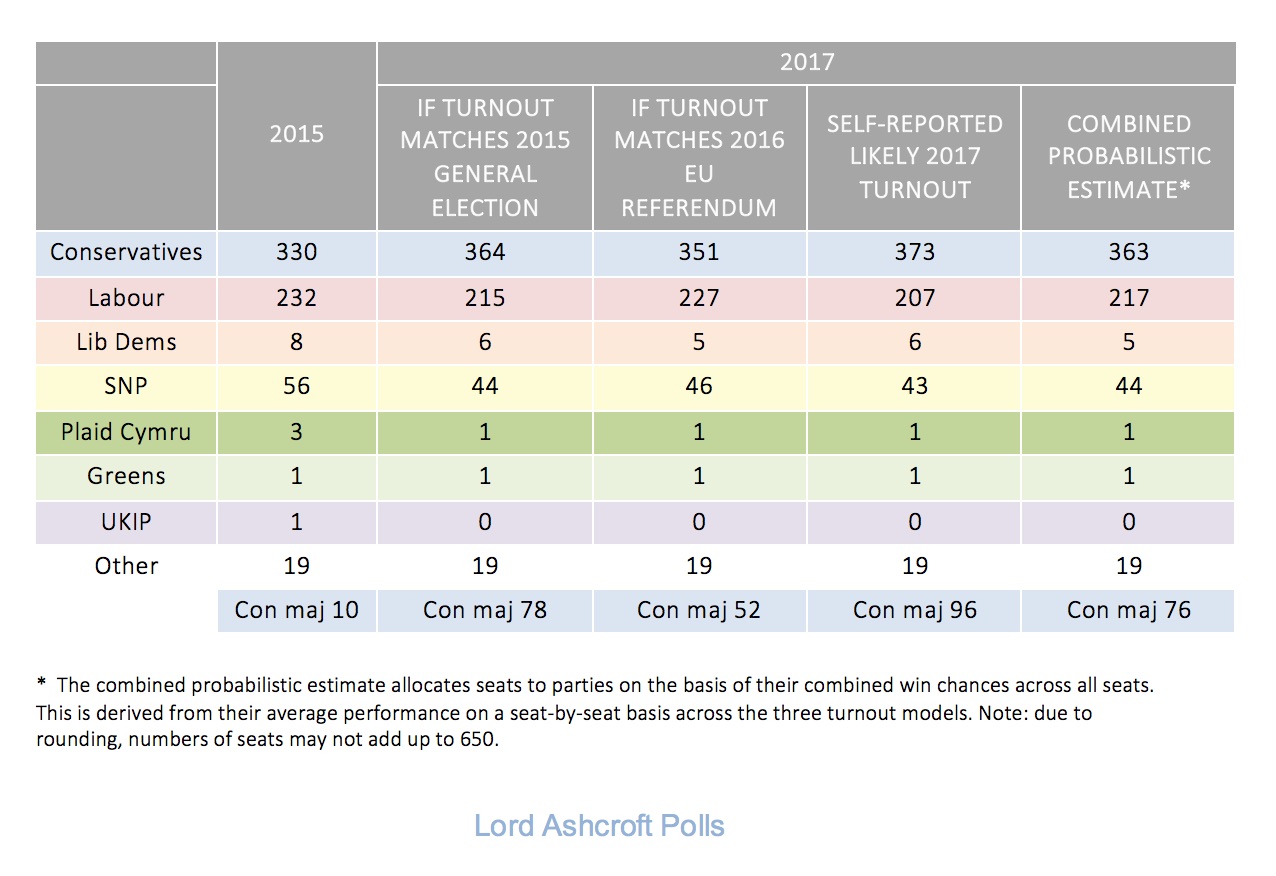
- Using voters’ self-declared likelihood to turn out, the model estimates 373 Conservative seats, or a Conservative overall majority of 96.
- If turnout were to match that of the 2015 election, the model estimates 364 Conservative seats, or a majority of 78.
- If everyone who claims to have voted in the EU referendum turns out, the estimated number of Conservative seats falls to 351, or a majority of 52.
Merging these three together and adding each party’s win chances in all the seats they are standing gives a “combined probabilistic estimate” of 363 seats, or a majority of 76, up from 64 in Tuesday’s update.
This is the first time since the launch of the Ashcroft Model that using people’s self-declared likelihood to vote has produced a bigger range of potential Conservative majorities than would be the case if the pattern of turnout matched the 2015 general election.
As always, a reminder that we are dealing with probabilities not predictions, and the numbers above represent the central points in a range of possibilities. The spread of probabilities for each turnout scenario is as follows:
![]()
Using people’s self-declared likelihood to turn out, the model finds a 63.3% likelihood of a Conservative majority between 80 and 119. If turnout matches 2015, the biggest probability (34.6%) is a majority between 60 and 79, with a 23.8% chance of a majority over 100. If everyone who claims to have voted in the EU referendum turns up to vote, implying a higher turnout than the other two models, the biggest probability is a Conservative majority between 40 and 59.
To highlight how turnout could affect the result we have introduced a new feature to the Ashcroft Model dashboard, which shows the potential effect of changes in participation. This shows different scenarios with different turnout levels by age (because younger voters are traditionally less likely to vote, and much depends on whether this will hold true next week), housing tenure (because social housing tenants tend to show lower turnout rates), and by EU referendum vote (because Leave voters are less likely than remainers to have voted in 2015, and it is debatable which group will feel more motivated to turn out this time).
Click here for full details of the final Ashcroft Model update, including potential majorities and the state of play in individual seats.