Only 7% of British voters support taking back asylum seekers who have crossed the border into Ireland without a deal for France to take back migrants from the UK, according to my latest poll. I also found that less than half think that concern for the Palestinians is among the main motivations for the university Gaza protests, and only 49% of 2019 Conservative voters are seriously considering staying with the party the next general election. Other issues include the reaction to better economic news, the local election aftermath, and our regular tracking measures.
Asylum, Ireland and the EU
In the wake of the row between Ireland and the UK over reports that asylum seekers have been crossing the Irish border in order to avoid being sent to Rwanda, we asked how people felt about the situation.
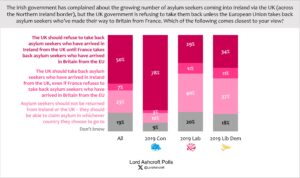
Half of all voters – including 78% of 2019 Tories and 87% of those leaning towards Reform UK – backed the government’s previously stated position that the UK “should refuse to take back asylum seekers who have arrived in Ireland from the UK until France takes back asylum seekers who have arrived in Britain from the EU”. This position was also backed by 84% of former Tories who did not vote for the party at the local elections and say the party will have to do a lot to win them back.
Only 7% thought the UK should take back asylum seekers from Ireland even if France refuses to take back migrants from the UK – the scenario that appears to have been the reality, given yesterday’s news that 50 asylum seekers were returned by Irish police after they crossed the border in October and February.
Just under a quarter (23%) of all respondents – including 40% of 2019 Labour voters – said asylum seekers should not be returned from either country but should be able to claim asylum in whichever country they choose.
University Gaza protests
With protests over the Gaza conflict spreading from US college campuses to British universities, we asked people what they thought were the demonstrators’ main motivations.

Fewer than half (41%) said they thought “concern for the plight of the Palestinians” was among the protesters’ main motivations. Next was “joining in with other students regardless of the cause” (31%), closely followed by “hostility towards Israel” (27%). Just over one in five (22%) thought the demonstrators were motivated by the idea of protesting against Western governments capitalism, while around one in six (16%) thought one of the motivations was hostility towards Jews more generally.
The economy
Following growth figures showing the British economy is officially out of recession, we found 36% of respondents saying they thought the economy was starting to improve, but only 17% saying they thought the government deserved credit for this. Just under one in five (19%) thought things were improving “but not because of anything the government has done”.
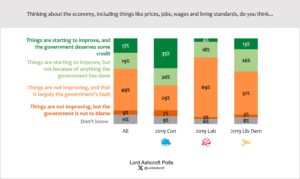
Meanwhile, the 54% who thought things were not yet improving were overwhelmingly likely to say this was “largely the government’s fault” (49%) rather than that “the government is not to blame for that” (5%). Only just over one third (35%) of 2019 Tories credited the government with improvements in the economy.
We asked people whether they thought four negative things were more likely to happen under Conservative or Labour governments in the next few years. In two cases – “higher taxes for people like me” and “new regulations that end up damaging businesses and costing jobs” – almost as many said they were more likely to happen under the Conservatives as under Labour.
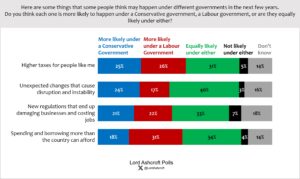
“Spending and borrowing more than the country can afford” was thought more likely under Labour by 31% and more likely under the Tories by 18%, with just over a third (34%) saying it was equally likely under either.
However, more thought “unexpected changes that cause disruption and instability” were likely to happen under the Conservatives (24%) than under Labour (17%), with 4 in 10 saying they were equally likely under both parties.
Those leaning towards Reform UK were much more inclined to think each negative event was more likely under Labour than under the Tories.
When asked how they thought things would change under different governments, people were around twice as likely to think the country as a whole would be better off after five years of Labour (37%) than after five more years of the Conservatives (18%).
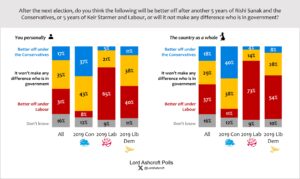
The margin was slightly narrower when we asked the same question for “you and your family”, with 31% saying they thought they were more likely to be better off after five years of a Labour government and 35% saying it would make no difference who was in office. Two thirds of those leaning towards Reform UK thought it would make no difference to their own situation who was in government, though more expected to be better off under five more years of the Tories (21%) than a term of Labour (6%).
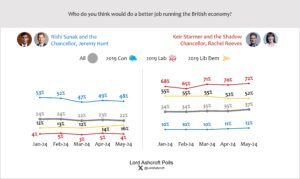
On the question of who would do a better job running the British economy, Starmer and Rachel Reeves extended their lead over Sunak and Jeremy Hunt from 12 to 15 points, with 41% saying “don’t know”. Just under half (48%) of 2019 Conservatives named Sunak and Hunt, down 1 point from last month.
Of those currently leaning towards voting for Reform UK, 30% named Sunak and Hunt, with only 6% naming Starmer and Reeves; 63% said “don’t know”.
What else has been going on?
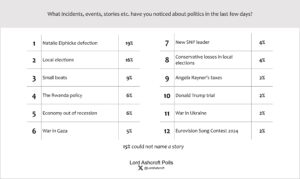
When we asked what political news stories people had noticed recently, the most popular answers were Natalie Elphicke’s defection to Labour, followed by the local elections and stories about small boats or Rwanda. Only 6% mentioned news about the economy coming out of recession.
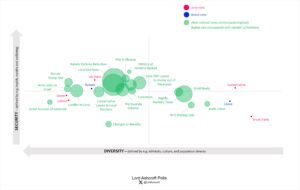
Plotting the results on our political map, we see that those mentioning stories about small boats, crime and Angela Rayner’s taxes are most likely to be found in the previously largely Conservative-voting, Brexit-supporting bottom right. Stories about the local elections, the Elphicke defection, and the Israel and Gaza were more likely to have been spotted in Labour/Lib Dem/Remain territory on the left-hand side of the map.
Local elections
We asked respondents who voted in the May local elections why they had chosen the parties or candidates they had. Overall, the biggest reason people gave for voting as they did was “I thought that candidate or party would do the best job locally” (41%). Next, people were equally likely to say their vote was “to show my support for that party” and “to stop the party I like least from winning in my area” (18% each). Among 2019 Conservatives who voted in the local elections, 12% said they had decided to “send a message that I’m not happy with a party I’ve supported in the past”.
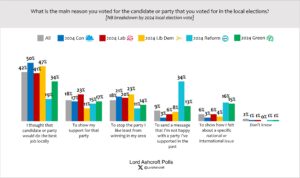
Those who voted Conservative in the May elections were the most likely to say this was for local reasons. Labour voters were the most likely to say they had been showing their support for a party, Lib Dem voters were most likely to be trying to stop the party they liked least from winning locally, and Reform UK voters were the most likely to be sending a message that they were unhappy with a party they had previously supported. Reform and Green voters were the most likely to be voting on a specific national or international issue.
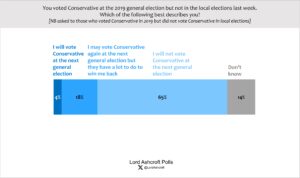
We also asked 2019 Conservatives who did not vote Tory this May how likely they were to turn out for the party again at the next general election. Around two thirds of them said they would either definitely (45%) or probably (20%) not vote Conservative at the next election, while only 4% said they definitely or probably would. 18% said “I may vote Conservative again at the next general election but they have a lot to do to win me back.”
The fundamentals
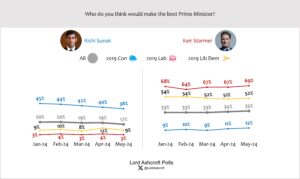
Keir Starmer leads Rishi Sunak as best PM by 18 points, up from 15 points in April, but still with 48% of respondents saying “don’t know”. The proportion of 2019 Conservatives naming Sunak dropped by 2 points to 38%.

Only 7% of all respondents and 9% of 2019 Conservatives said they were satisfied with the current government – both down 1 point since last month. Just over one third (35%) said they were dissatisfied but would rather have it than a Labour government (down 2 points) while 57% said they were dissatisfied and would prefer a Labour government.
More than three quarters (76%) of those currently intending to vote Reform UK said they were dissatisfied but would rather have this government than a Labour government, compared to 22% saying they would rather see Labour in office.
The next election
We asked 2019 Conservative voters which parties they were seriously considering at the next general election. Fewer than half (49%) named the Conservative Party, including 58% of those who said they were dissatisfied with the current government but would prefer it to a Labour government.

Just over 3 in 10 (31%) said they were considering Reform UK, compared to 20% who said they were considering Labour and 10% the Liberal Democrats.
2019 Tories who voted Remain in the Brexit referendum were slightly more likely to say they were considering the Conservatives (56%) than those who voted Leave (48%).
In our regular voting intention question we ask respondents how likely they think they are to end up voting for each party at the next election, where 100 means “definitely” and zero means “definitely not”. Those who voted Conservative in 2019 put their chances of doing so again at an average of 43/100, unchanged since last month. This compares to 2019 Labour voters’ 68/100 likelihood of sticking with Labour. In Scotland, former SNP voters now put their likelihood of sticking with their party at 50/100.
Among 2019 Tories who did not vote Conservative in the May local elections but say they may do so at the election “but they have a lot to do to win me back”, the average likelihood of voting Conservative is currently 26/100.
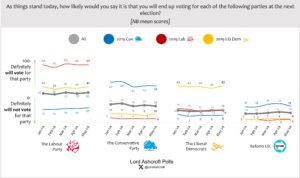
Taking into account those whose highest score for one party was at least 50/100, this implies vote shares of Labour 45%, Conservative 22%, Reform UK 11%, and the Greens and Lib Dems tied on 8%.
Among those who say they are dissatisfied with the Conservative government but prefer it to a Labour government, 41% currently say they will not vote or don’t know how they’ll vote. Among those whose highest likelihood of voting for one party was above 50/100, the implied vote share was Conservative 53%, Reform UK 25%.

Overall, just over half (55%) said that from talking to friends and family and from what they heard generally, most people had already made their minds up which way to vote at the next election; just 23% said they thought most people were waiting to see what happened between now and then. However, nearly half (48%) of 2019 Tories said they thought most people fell into the second category.
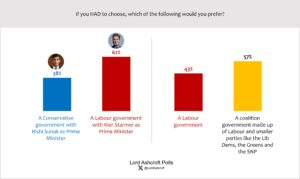
In a forced choice, 62% of respondents said they would prefer a Labour government with Keir Starmer as PM to a Conservative government with Rishi Sunak as PM (38%). One in four 2019 Tories chose Labour and Starmer. Those leaning towards Reform UK preferred Sunak and the Conservatives by 73% to 27%.
Asked if they would rather have a Labour government or a Labour-led coalition with smaller parties like the Lib Dems, Greens and the SNP, respondents as a whole chose the latter by 57% to 43%. Labour voters were the only group to prefer a Labour-only government.
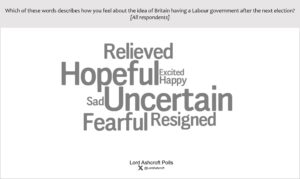
We asked people to choose from a range of words that might describe how they felt about the prospect of a Labour government. The most popular choices overall were “uncertain” (picked by 35%) and “hopeful” (34%), followed by “fearful” (25%), “relieved” (22%) and “resigned” (19%). Only 11% chose “happy” and 9% “excited”.
Among those currently intending to vote Conservative, the words most often chosen were “fearful” (60%) and “uncertain” (46%). For Labour voters, they were “hopeful” (72%) and “relieved” (51%). Among those currently intending to vote for Reform UK, they were “fearful” (65% – more than among Tories), “uncertain” (40%) and “resigned” (38%).
The political map
Our political map shows how different issues, attributes, personalities and opinions interact with one another. Each point shows where we are most likely to find people with that characteristic or opinion; the closer the plot points are to each other the more closely related they are.

Here we see that those who voted in the local elections to send a message that they’re unhappy with their previous party, and who feel that whoever is in government will make no difference to whether they and their family will be better off in 5 years’ time, are most likely to be found in the less prosperous, less diverse bottom right quadrant, where the Conservatives drew much of their support at the 2019 election and the Reform UK vote is also most likely to be found. We can also see that the centre of gravity of the Conservative vote has moved further into the more prosperous top-right quadrant, while the Labour vote has moved somewhat towards the centre. It is also notable that those thinking that concern for the Palestinian people is among the main motivations of the university Gaza protesters are most likely to be found in the Labour/Green supporting territory towards the top left quadrant, while those thinking the motivations include hostility university authorities, Israel or Jews generally are found closer to Conservative-leaning territory on the right-hand side of the map.